

Account schedules, Financial Reports, Analysis Views, dimensions-based slicing, and the reporting habits that separate a finance team that trusts its numbers from one that’s constantly second-guessing them.
How BC’s Reporting Architecture Works — The Layers
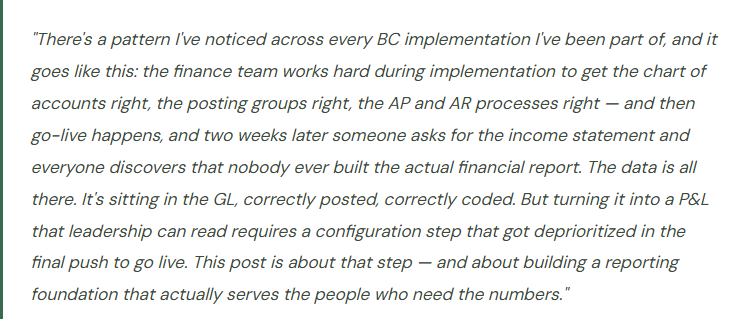
Before we get into the configuration steps, it helps to understand how reporting in BC is structured. There are several reporting layers, and they serve different audiences and purposes. Knowing which layer to reach for — and when — makes the whole picture less confusing than it initially appears.
Most BC finance teams need to build competency in the top three layers — Financial Reports for formal statements, Analysis Views for dimensional slicing, and Column Layouts for period comparisons. The standard reports handle operational day-to-day. Power BI is a conversation for later, once your data quality is solid and leadership has a clear sense of what they want to see visually.
With that map in place, let’s build an actual income statement.
Financial Reports — Building Your Income Statement from Scratch
Financial Reports in BC (called Account Schedules in older versions — same thing, renamed in recent releases) are the tool for building your formal financial statements. The Income Statement, Balance Sheet, and Statement of Cash Flows are all built here. They’re not pre-built for you in a way that’s ready to use — they need to be configured to match your chart of accounts, your reporting structure, and the level of detail your leadership wants to see.
This configuration step is where most implementations fall short. It’s not technically difficult, but it requires someone who understands both the chart of accounts structure and what the financial statements need to look like — which means Finance needs to own this, not the implementation consultant.
01 Create the Financial Report Definition
Name it, describe it, assign the row definition and column layout
- Navigate to Financial Reports in BC and create a new report.
- Give it a clear, functional name — “Income Statement – Monthly,” “Balance Sheet – Period End,” “Departmental P&L.”
- The report definition links two separate configurations together: a Row Definition (what lines appear in the report and what they calculate) and a Column Layout (what time periods or comparisons appear across the columns).
- You build these separately and combine them here. That separation is intentional — the same row definition can be used with multiple column layouts, which means you build the Income Statement structure once and then view it with current period columns, year-to-date columns, or budget variance columns by simply swapping the column layout.
Before You Start Building
- Have your chart of accounts open and finalized — you’ll be referencing GL account numbers throughout the row definition build
- Decide on the reporting structure first: how many sections, what subtotals, what level of line-item detail. Sketch it on paper before opening the setup page.
- Know who the audience is — a board-level income statement has far fewer lines than a Controller’s monthly review. Consider building both as separate reports with the same underlying row definition.
02 Build the Row Definition — The Heart of the Report
Each row is a line on your financial statement — accounts, totals, headings, and spacing
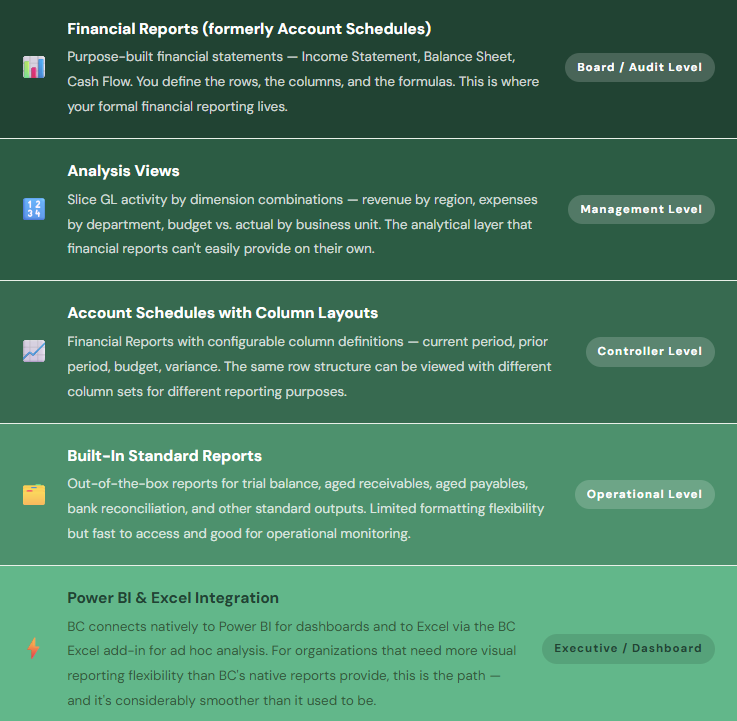
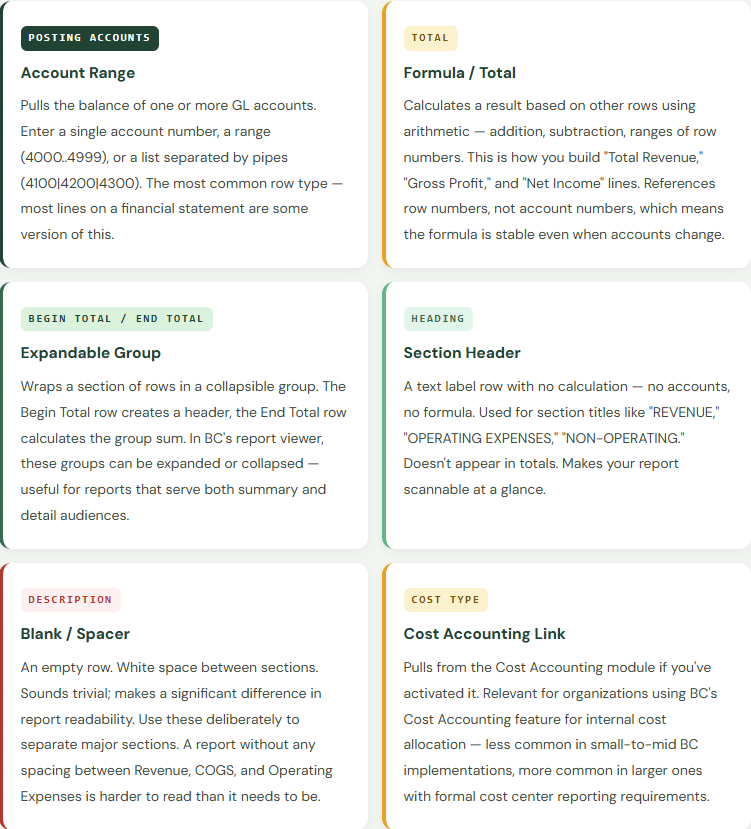
The Row Definition is where you construct the actual structure of your financial statement, line by line. Each row has a type that determines what it does. Understanding the row types available is the core skill of financial report building in BC — once you know what each type does, the rest is financial statement structure knowledge you already have.
For an income statement, the typical structure looks like this: a header row (“REVENUE”), then posting account rows for each revenue GL account or range, a total formula row (“Total Revenue”), then another header (“COST OF GOODS SOLD”), posting account rows, total formula row, a calculated row for Gross Profit, and so on down through operating expenses, EBITDA, depreciation, and net income. The rows you create here become the lines your leadership reads every month.
Row Definition Best Practices
- Use account ranges (e.g., 4000..4999) rather than listing every individual account — when you add a new GL account within the range, it automatically appears in the report without editing the row definition
- Name your rows with the same language your leadership uses in board presentations — this is not the place for accounting codes and abbreviations
- Build subtotals at every natural grouping — revenue by category, then total revenue; COGS by category, then total COGS. Subtotals make the report readable and allow drilling at multiple levels.
- Add blank row separators between sections — white space makes financial statements easier to read and reduces the chance of misreading a line
03 Understand Your Row Type Options
Six row types — each one does something different
This is where most first-time Financial Report builders get stuck — the row type options in BC look technical until you understand what each one is for. Here’s the plain-language version:
04 Build Column Layouts — What Appears Across the Top
The same P&L, multiple views, one row definition
Column layouts define the time periods, comparison periods, and calculated fields that appear across the columns of your report. A column can show the current period’s net change, a year-to-date balance, a budget amount, a variance, or a percentage. You configure each column separately and arrange them in whatever order serves your reporting audience.
The most common column layouts worth building during implementation are: a Monthly Review layout (current month actuals, prior month actuals, current month budget, budget variance, YTD actuals, YTD budget), and a Prior Year Comparison layout (current period actuals, same period prior year, variance in dollars, variance as percentage). Build both. They serve different conversations — the monthly layout for the Controller’s close review, the prior year comparison for the board.
Column layouts in BC reference column type — Net Change, Balance at Date, or Beginning Balance — and a date filter formula that determines which period the column covers. Date formula syntax in BC uses characters like P (period), Y (year), C (current) to define relative periods. The current period column is CP. The prior period is CP-1. Year to date is -CY. This syntax looks cryptic the first time and becomes second nature quickly. There’s a full reference in BC’s help documentation, and it’s worth bookmarking.
Column Layouts Worth Building at Go-Live
- Monthly P&L: Current month / Prior month / Current month budget / $ variance / YTD actuals / YTD budget
- Prior year comparison: Current period / Same period prior year / $ change / % change
- Rolling 12 months: One column per month for the trailing twelve — useful for trend visibility without needing a separate chart
- Budget-only layout: Used during budget season to review the plan before actuals exist
What a Well-Built Income Statement Looks Like
Here’s an example of what the Financial Report output looks like when the row definition and column layout are built correctly. This is the structure leadership actually wants to read — not a trial balance export, not a general ledger listing, but a formatted income statement with sections, subtotals, and comparison columns.
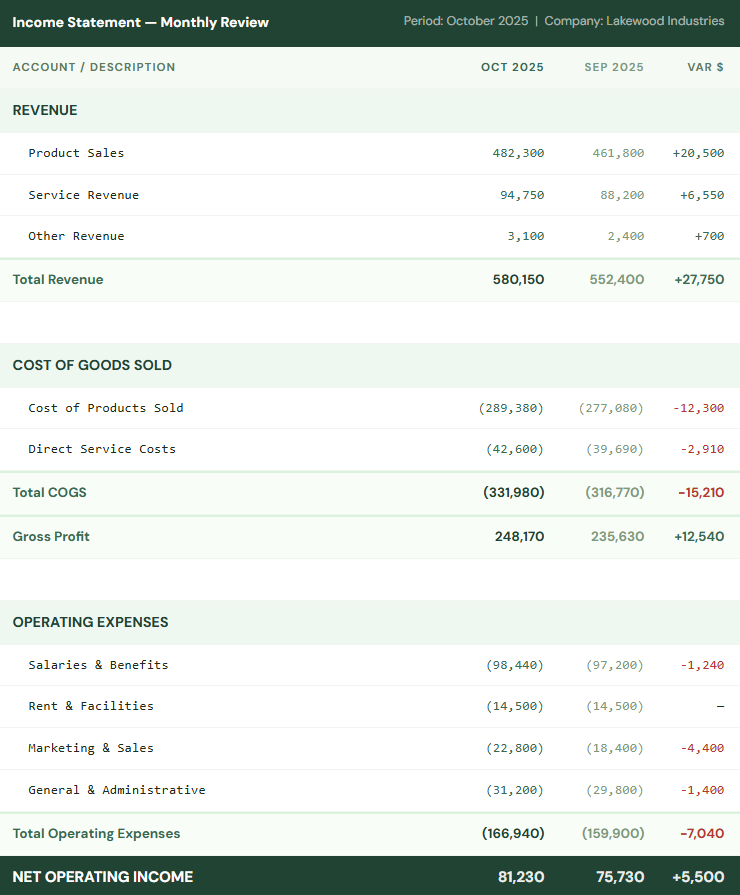
That report is built entirely from a row definition and a column layout in BC’s Financial Reports feature. The numbers come directly from the GL — no export, no Excel manipulation, no intermediate reconciliation step. It refreshes every time it’s run, always reflecting current posted data. If you’ve been building this kind of report by hand in Excel every month, you already understand why getting this configuration right during implementation is worth every minute it takes.
Budgets in BC — What They Enable in Reporting
BC has a native budget feature that lets you enter budget amounts by GL account and accounting period directly in the system. Once a budget is entered, it becomes available as a column in your Financial Reports — “Budget,” “Budget Variance,” “% of Budget” columns can all reference the same budget. This is what turns your monthly income statement from a pure actuals view into the budget-versus-actual comparison that most Finance teams actually need for management reporting.
To enter a budget in BC, you create a Budget Name (which lets you maintain multiple budget versions — “FY2026 Original,” “FY2026 Revised Q2,” and so on), then enter amounts by account, period, and optionally by dimension. Budget entries can be made manually, imported from Excel, or copied from prior year actuals with an adjustment percentage — which is the fastest way to create a starting-point budget for the upcoming year.
Analysis Views — Where Dimensions Become Reporting Power
If Financial Reports answer “how much did we make or spend in total,” Analysis Views answer “how much did we make or spend broken down by department, region, product line, or any other dimension you’ve defined.” This is the reporting layer that makes your dimension design decisions from early in the implementation feel worthwhile — or reveals that those decisions weren’t made carefully enough.
An Analysis View in BC is a pre-configured slice of GL activity by up to four dimensions simultaneously. You define which accounts to include, which dimensions to filter on, and BC maintains a running summary of activity along those dimension intersections that you can query and pivot. The output can be viewed in BC’s Analysis by Dimensions page or exported to Excel for further manipulation.
01 Revenue by Department
A classic Analysis View: revenue accounts sliced by the Department dimension. Shows each department’s contribution to total revenue for any period you specify. Useful for internal management reporting where accountability is department-based and you need more granularity than the consolidated income statement provides.
02 Expenses by Region × Cost Center
Two dimensions simultaneously — Region and Cost Center. Shows operating expenses at the intersection of geographic region and functional cost center. Answers questions like “what did the Northeast sales team spend on marketing?” that a flat income statement can’t answer without a filter that changes the whole report.
03 COGS by Product Line
Cost of goods sold broken down by product category or product line dimension. Feeds into gross margin analysis by segment — what is the margin on our hardware products versus our software products versus our services? A required analytical capability for any product company with differentiated margin profiles across their portfolio.
04 Budget vs. Actual by Business Unit
Combines the budget you entered in BC with dimension-based actual tracking to show budget versus actual at the business unit level. Requires that your budget was entered with the relevant dimension values, not just as an account total — which is a configuration decision to make when you’re entering the budget, not when you need the report.
Analysis Views require consistent dimension coding to be useful. If twenty percent of your transactions are posted without dimension values — because default dimensions weren’t configured, or because the team wasn’t trained to enter them, or because someone bypassed the required field — then your Analysis View results show eighty percent of your activity and your totals don’t tie to the income statement. The Analysis View is a magnifying glass for your dimension data quality. What it reveals when you first run it tells you a lot about how well the setup and training were executed.
If you find significant gaps, don’t try to correct them with journal entries — correct the process and the training, then accept that historical data has known limitations. Document those limitations so leadership understands why the YTD figures in the dimensional view don’t tie to the income statement for the early periods, and focus on getting the ongoing data right from here forward.
The Financial Reports That Every BC Organization Should Build
There’s a minimum viable reporting set that every BC implementation should deliver before go-live. These aren’t optional enhancements — they’re the output that justifies the investment in getting the chart of accounts, posting groups, and transaction processing right. If you have accurate data in the system but no way to read it, the data doesn’t help anyone.
| Report | What It Shows | Who Uses It | Minimum Column Layout |
|---|---|---|---|
| Income Statement | Revenue, COGS, gross profit, operating expenses, net income for the period | Leadership, Controller, Board | Current month / Prior month / Budget / Variance / YTD actuals / YTD budget |
| Balance Sheet | Assets, liabilities, and equity at a point in time | Controller, CFO, lenders, auditors | Current period balance / Prior period balance / $ change |
| Departmental P&L | Income statement filtered or segmented by department or cost center dimension | Department managers, Controller | Current month actuals / Budget / Variance — by department column or as a filtered report per department |
| Trial Balance | All GL accounts with opening balance, period activity, and closing balance | Controller, auditors, during close | Available as a standard BC report — doesn’t require Financial Report build; just needs to be tested and formatted |
| Cash Flow Statement | Operating, investing, and financing cash flows for the period | CFO, lenders, board | BC has a Cash Flow Forecast feature — the formal cash flow statement requires a Financial Report row definition built around your cash flow accounts and reclassification logic |
| Aged AR & AP | Outstanding customer balances and vendor balances by aging bucket | AR/AP team, Controller | Available as standard BC reports — confirm aging buckets match your internal reporting periods before go-live |
Useful KPI Tiles and the Role Centres
Beyond formal reports, BC’s Role Centres — the home pages that different user types see when they log in — surface key performance indicators and activity cues in real time. The Finance Manager Role Centre, for example, shows outstanding AP balance, AR balance, overdue invoices, bank account balances, and cash flow indicators on a dashboard that updates continuously as transactions post.
- Outstanding AR
- Total open customer balances — the number your collections team monitors daily and your Controller checks at period close.
- Overdue Invoices
- Count and value of invoices past due date. Trends upward when collections process needs attention; trends downward when it’s working.
- Bank Balance
- Book cash balance for each bank account. Updated with every posted cash transaction. Doesn’t replace bank reconciliation — but gives a real-time book balance view at a glance.
- Payables Due
- AP obligations coming due within your defined horizon. Feeds into cash planning — knowing what’s due in the next 7, 14, and 30 days before you run your payment proposal.
- Monthly Revenue
- Current month revenue as of the last posted invoice. Not a closed-period figure — it reflects whatever’s been posted so far this period. Useful for in-month tracking, not period-end reporting.
- Cash Flow Forecast
- BC’s Cash Flow Forecast pulls from open receivables, payables, sales orders, and purchase orders to project near-term cash position. Requires the Cash Flow Forecast feature to be configured — underused but genuinely valuable for cash-conscious organizations.
Role Centre KPI tiles are a legitimate reporting tool — not just a dashboard cosmetic. When the Finance Manager’s Role Centre shows overdue invoices trending up, that’s a prompt to open the AR aging and investigate before it becomes a month-end conversation. When the bank balance tile looks off, that’s a trigger to check whether a recent large payment has been reconciled. Used as a daily monitoring habit, the Role Centre reduces surprises significantly.
Connecting BC to Excel and Power BI
For organizations that need more analytical flexibility than BC’s native reporting provides — more visual formatting, multi-company consolidations, scenario modeling, executive dashboards — BC connects natively to both Excel and Power BI in ways that have improved substantially in recent releases.
The Edit in Excel feature, available throughout BC on list pages and journals, opens BC data directly in Excel with a live connection — changes made in Excel can be published back to BC, and the data refreshes on demand. This isn’t a one-time export — it’s a connected session. For budget entry, for mass updates, for ad hoc analysis, this connection is genuinely useful and saves time compared to manual import/export cycles.
The Power BI integration in BC lets you embed Power BI reports directly on Role Centre pages and connect to BC’s standard Power BI datasets — which include pre-built data models for finance, sales, purchasing, and inventory. For organizations where leadership wants visual dashboards rather than formatted financial report outputs, the Power BI path is the right one. It requires someone with Power BI skills to build the reports, which is a separate competency from BC configuration, but the underlying data connection is solid and well-supported by Microsoft.
The Reporting Mistakes That Cost BC Finance Teams the Most
⚠️ Building the Income Statement After Go-Live Instead of Before It
This is by far the most common reporting gap I see in BC implementations. The financial report build — row definitions, column layouts, the income statement that Finance will actually use — gets deprioritized in the final weeks before go-live in favor of transaction testing and data migration. Then go-live happens, the first period closes, and Finance discovers they have a fully populated general ledger and no income statement to read it from. They export to Excel and build one manually. Which takes a week. And then someone asks for next month’s version and the whole thing has to be done again.
→ Build and test your Financial Reports — Income Statement, Balance Sheet, at minimum — as a go-live deliverable, not a Phase 2 enhancement. Block time in the implementation schedule specifically for financial report configuration, treat it as an acceptance criterion alongside transaction processing, and have Finance sign off on the report format before go-live. The configuration takes a few days. The discipline to do it before go-live instead of after is the harder part.
⚠️Using Individual Account Numbers Instead of Ranges in Row Definitions
A row definition that lists every individual GL account number — 4100, 4110, 4120, 4130, and so on — instead of a range (4100..4199) will break the moment a new account is added to the chart of accounts. The new account posts correctly to the GL but doesn’t appear in the income statement because it’s not in the row definition. Revenue is understated. Nobody notices for a while because the new account was recently added and has low volume. Then it accumulates enough balance that the income statement and the trial balance disagree, and someone spends an afternoon figuring out why.
→ Use account number ranges in every posting account row where it’s practical. Design your chart of accounts numbering specifically to enable this — revenue accounts in the 4000s, COGS in the 5000s, operating expenses in the 6000s — so that an entire income statement category can be captured with a single range expression. Then when new accounts are added within the range, the report automatically includes them.
⚠️No Budget Data in BC — So Budget vs. Actual Is Always an Excel Exercise
The most useful column in a monthly management report is the budget variance column. It tells leadership not just what happened but whether what happened was expected. In BC, that column requires a budget to be entered in the system — something many organizations simply never do. The budget lives in an Excel workbook on the CFO’s desktop, the actuals come from BC, and someone reconciles them manually every month in a separate Excel file that’s one overwrite away from being wrong. The comparison report that leadership wants is never actually automated.
→ Enter your approved annual budget into BC by the start of each fiscal year. Even a high-level budget — by major account grouping and period, without detailed dimension breakdowns — is enough to enable the budget versus actual column in your monthly report. Import it from Excel using BC’s budget import template if manual entry isn’t practical. One annual effort creates twelve months of automated budget comparison reporting. That tradeoff is almost always worth making.
⚠️ Analysis Views Built but Dimension Coding Never Enforced
This is the dimension gap problem, and it’s particularly visible in reporting. An Analysis View for “Revenue by Region” that shows 65% of revenue with a region assigned and 35% with a blank region isn’t a regional revenue report — it’s a partial picture that’s more misleading than no report at all. You can’t make decisions based on regional revenue when a third of your revenue has no region attached. The Analysis View is configured correctly. The data feeding it isn’t.
→ Configure dimensions as required fields on the GL accounts where dimension analysis matters — revenue and COGS accounts especially. BC will require a dimension value before a transaction posts to those accounts, preventing the silent gap from accumulating. Do this during implementation, not retroactively. And accept that the first period after enforcing required dimensions will feel like friction to the team — that friction is the correction of a prior process gap, and it gets smoother quickly once the habit is established.
⚠️ Financial Reports That Were Never Reconciled to the Trial Balance
A Financial Report that looks right isn’t necessarily right. A missing account range, a formula error in a total row, an account that was recategorized in the chart of accounts without the row definition being updated — any of these can produce a formatted income statement where the net income figure doesn’t match the GL closing entry. If nobody has ever confirmed that the income statement output ties to the trial balance, the report has an unknown error rate. Leadership is making decisions based on it. The error might be immaterial. It might not be.
→ As part of your period-close process, add a step: reconcile net income on the Financial Report income statement to the net income balance on the trial balance. They should agree to the penny. If they don’t, trace the difference before closing the period. This is a ten-minute step when done regularly and an hours-long investigation when done for the first time after months of accumulated variance.
⚠️ Delivering Reports That Leadership Can’t Read
This one sounds softer than the others but the consequences are just as real. A financial report configured with account codes for row labels (“4100-4199 Revenue — Product”), abbreviated section headers that mean something to the accountant who built it and nothing to the VP reading it, and no clear total structure produces a report that leadership either ignores or misreads. The data is accurate. The presentation is unusable. Finance loses credibility not because the numbers are wrong but because nobody can find the number they’re looking for without asking for help.
→ Show your Financial Report draft to the person who will present it at the next board meeting and ask them to read it out loud. Where they hesitate, rename the row. Where they ask a question, restructure the section. Where they say “I usually look at X here” and X isn’t visible without scrolling through fifteen lines, restructure the layout. A financial report is a communication tool. Test it with the audience before you call it done.
Quick Reference: Do’s and Don’ts
✓ Do This
- Build Income Statement and Balance Sheet Financial Reports as go-live deliverables, not Phase 2
- Use account number ranges in row definitions — not individual account numbers
- Build at least two column layouts: monthly review (vs. budget) and prior year comparison
- Enter your approved annual budget in BC to enable automated budget vs. actual reporting
- Reconcile Financial Report output to the trial balance at every period close
- Name report rows with the language leadership uses, not accounting codes
- Configure dimensions as required fields on revenue and COGS accounts where analysis matters
- Build at least one Analysis View for revenue by dimension before go-live
- Test financial reports with real posted data in production — not just in sandbox
- Show draft reports to the presentation audience before calling them done
- Add blank spacer rows between major report sections for readability
- Build a departmental P&L report alongside the consolidated income statement
✗ Don’t Do This
- Deprioritize Financial Report configuration in the go-live sprint
- List individual account numbers in row definitions instead of ranges
- Keep the budget in an Excel file that never syncs to BC
- Build Analysis Views without first ensuring consistent dimension coding on transactions
- Build Power BI dashboards before your underlying data quality is stable
- Accept a financial report that hasn’t been reconciled to the trial balance
- Deliver a report to leadership that nobody reviewed for readability first
- Ignore Role Centre KPI tiles — configure them for Finance users and train the team to monitor them
- Use one column layout for every audience — board, Controller, and department managers need different views
- Leave the Cash Flow Forecast feature unconfigured — it’s included in BC and provides real cash planning value
- Build the Balance Sheet without confirming that all balance sheet accounts are in the row definition
- Change account numbers in the COA without updating the row definitions that reference them
The thing I tell every Controller I work with: financial reporting in BC is the payoff on every setup decision you made earlier in the implementation. The chart of accounts structure you agonized over in month one — you see it reflected in how cleanly the income statement sections fall out. The dimension design you mapped out — you see it in whether the regional revenue analysis is meaningful or full of holes. The posting group decisions — you see them in whether COGS and revenue are landing where they’re supposed to.
When reporting is working well, it’s nearly invisible — numbers appear where expected, they tie to the trial balance, and leadership reads the report without questions about what something means or why a number looks off. That invisibility is the goal. Build the reporting foundation carefully, test it thoroughly, and the monthly close becomes a confirmation process rather than an investigation. That’s what good ERP reporting should feel like.
Up Next:
We’ve covered the financial foundation — chart of accounts, posting groups, AP, AR, and reporting. Next, we’re moving into the operational side of BC: Inventory and Item Setup in Business Central — item cards, item tracking, costing methods, locations, and how BC connects your warehouse to your general ledger. If you have physical inventory and you’re implementing BC, this post is the one that explains why the item card is as important to Finance as it is to Operations — and what configuration decisions made there will follow you through every inventory transaction for the life of your system.
Until then — build your income statement before go-live, use account ranges in your row definitions, and put your budget in the system where it can actually do something useful.
— Bobbi
D365 Functional Architect · Recovering Controller
Leave a Reply