
The Cost Accounting module, cost objects, allocation hierarchies, overhead calculation, and how D365’s dedicated cost accounting layer produces management P&L reporting that the general ledger — even with dimensions — simply cannot deliver on its own.

Why the GL Alone Isn’t Enough for Management Profitability Analysis
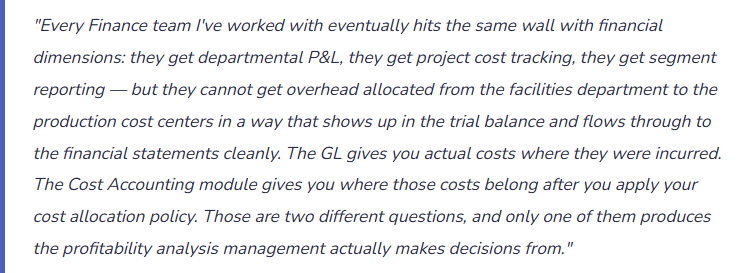
The general ledger in D365 F&O — even with financial dimensions — records costs where they were incurred in the organization. Utilities expense hits the facilities department because that’s who pays the bill. IT infrastructure cost hits the IT cost center because that’s where the budget sits. HR department payroll hits HR because that’s where the employees are. These are the right accounts for statutory financial reporting: accurate, auditable, tied to actual transactions.
Management profitability analysis needs something different: costs allocated to the products, services, or business units that actually consumed them. The production department doesn’t pay the facilities utility bill directly, but it consumes 60% of the facility’s floor space. Product line A doesn’t have an IT line item in its P&L, but it runs 40% of the ERP system’s transaction volume. Management wants to know: after allocating the shared service costs to the product lines that consumed those services, which product lines are actually profitable and which are cross-subsidized by the healthy ones?
Financial dimensions can tag transactions with department or product line codes, but they don’t reallocate costs from where they were incurred to where they were consumed. That reallocation is what D365 F&O’s Cost Accounting module exists to produce.
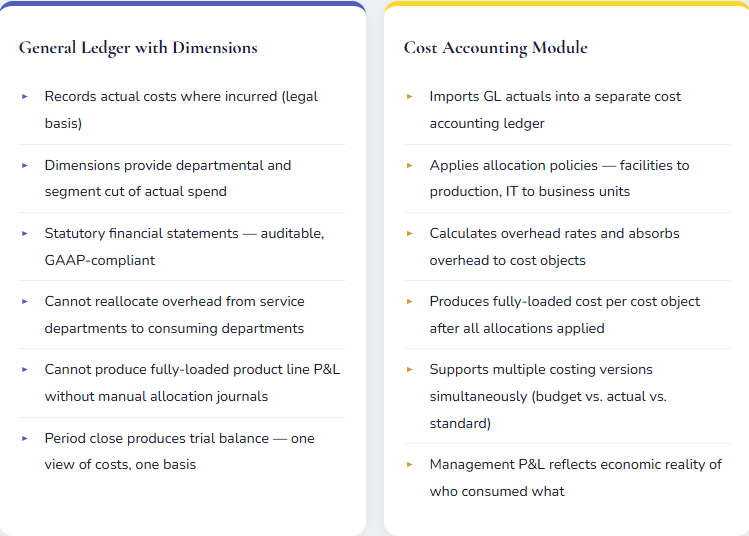
The key architectural point: the Cost Accounting module operates in a separate ledger — the cost accounting ledger — that is distinct from the general ledger. GL entries are imported into Cost Accounting as source data, then reallocated through the cost accounting allocation engine. The allocations in Cost Accounting do not create GL journal entries. They produce management reporting that can diverge from the statutory trial balance by the amount of the allocation adjustments — which is precisely the point. The GL is for auditors. Cost Accounting is for management.
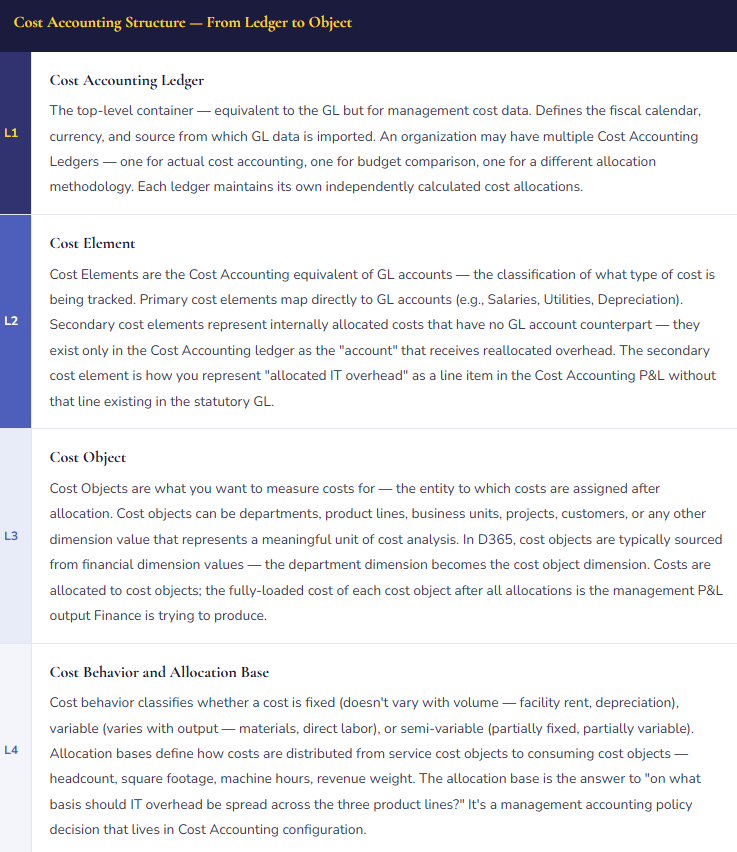
The Cost Accounting Hierarchy — Four Levels
D365 F&O’s Cost Accounting module uses a four-level conceptual structure. Understanding how these levels connect is essential before any configuration starts — because Cost Accounting’s hierarchy is designed top-down from reporting requirements, not bottom-up from transaction posting.
Overhead Calculation — The Engine That Produces Fully-Loaded Cost
The overhead calculation is the core process in Cost Accounting — the step that takes actual costs imported from the GL, applies allocation policies through the hierarchy, and produces the fully-loaded cost per cost object. It runs periodically (typically monthly as part of the management reporting close) and can be run for any period with actual cost data available.
Step 1 — Import GL Actuals: Cost Accounting imports GL actual costs for the period from the designated source entries (GL accounts mapped as primary cost elements). Imported amounts land in the Cost Accounting ledger against the primary cost elements for each cost object (dimension) that tagged those transactions in the GL.
Step 2 — Classify Cost Behavior: Costs in each primary cost element are classified as fixed or variable. This classification determines how overhead rates are calculated — fixed costs are allocated on a capacity basis independent of volume; variable costs are absorbed based on actual activity.
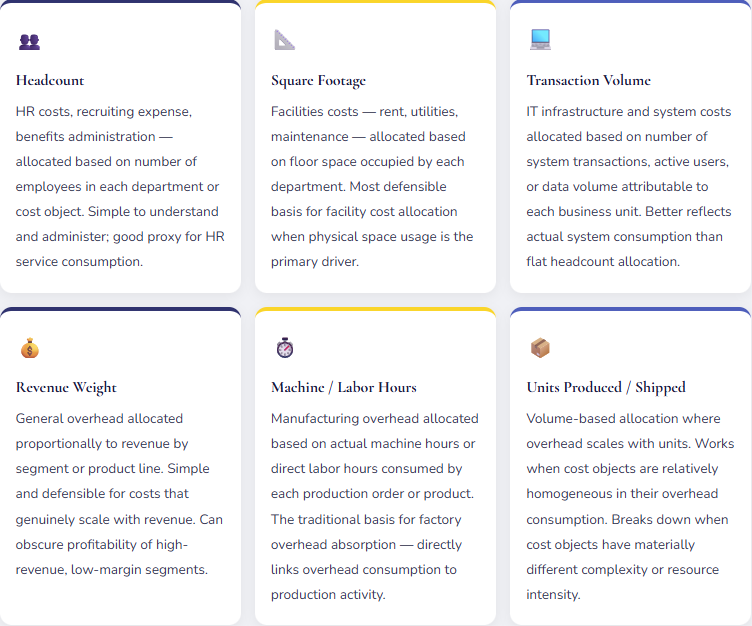
Step 3 — Apply Allocation Policies: The allocation engine applies allocation rules — transferring costs from service cost objects (IT, Facilities, HR) to production or revenue-generating cost objects using the configured allocation bases. Multiple rounds of allocation can run in sequence: Facilities allocated to all departments, then IT allocated (including IT’s newly absorbed facilities cost) to all departments, then HR allocated — building up a fully-loaded cost for each final cost object through the allocation cascade.
Step 4 — Calculate Overhead Rates: For manufacturing or service organizations that need a predetermined overhead rate (for product costing or billing rate purposes), Cost Accounting calculates the overhead absorption rate — total allocated overhead divided by the planned activity base. This rate is then applied to actual activity to determine overhead absorbed vs. actual overhead incurred, with the difference representing over- or under-absorbed overhead.
Cost Versions — Comparing Actual, Budget, and Standard
One of Cost Accounting’s most valuable capabilities is the ability to maintain multiple costing versions simultaneously and compare them in management reporting. Each version represents a different view of cost — what was budgeted, what the standard predicts, what actually happened.
| Costing Version | What It Contains | How It’s Used | Update Frequency |
|---|---|---|---|
| Actual Cost Version | Costs imported from GL actuals for the period, after all allocation rules applied | The “what happened” baseline — management P&L reflecting actual spending allocated to cost objects. Primary basis for period reporting. | Monthly, when overhead calculation runs for the period |
| Budget Cost Version | Planned costs by cost element and cost object, based on the annual budget | Budget vs. actual variance analysis at the cost object level. Shows which departments and product lines are over or under budget after allocation adjustments. | Annually (at budget time), revised when forecasts are updated |
| Standard Cost Version | Predetermined rates — standard overhead rates, standard labor rates — used for product costing or billing rate development | Calculates standard cost per unit for manufactured items or standard billing rates for service delivery. Variance vs. actual highlights efficiency and rate changes. | Annually (at standard cost update time) or when rate structure changes |
| Forecast Cost Version | Rolling forecast costs reflecting current expectations, updated more frequently than budget | Current-year outlook for management reporting when the annual budget has become stale. Enables budget vs. forecast vs. actual three-way comparison in the management P&L. | Quarterly or monthly, depending on organization’s forecasting cadence |
The management P&L report that Finance produces from Cost Accounting typically shows actual cost by cost object, budget by cost object, and the variance — by cost element, by allocation type, by period. This is the report that answers “why did Product Line B’s fully-loaded cost increase 12% this quarter?” with specificity: “Allocated IT overhead increased 18% because the IT department’s total cost grew and Product Line B’s transaction share increased.” That level of cause-and-effect is not available from the GL trial balance alone.
Four Mistakes That Produce a Cost Accounting Implementation Nobody Uses
⚠️ Cost Accounting Configured Before Management Reporting Requirements Are Defined
Cost Accounting is a module that exists to produce specific management reports — and every configuration decision (cost object structure, allocation bases, cost element mapping, version setup) is driven by what those reports need to show. Implementations that configure Cost Accounting before anyone has defined “what management P&L do we want to produce and at what level of granularity?” produce a system that calculates something without anyone being clear on whether the output answers the right questions. The cost accounting team built a model. Management looks at the output and says “this isn’t what we asked for.” Six months of configuration effort, and the reports still don’t replace the Excel-based management P&L that Finance has been producing manually.
Fix: Before any Cost Accounting configuration begins, produce a mock-up of the management P&L report you want to generate from the system — on paper, in Excel, however. Define the rows (cost elements), the columns (cost objects), and the level of allocation detail visible. Then work backward from that report mock-up to the configuration required to produce it. Every configuration decision should be traceable to a specific element of the target report. If you can’t trace a configuration choice to a reporting requirement, question whether it needs to exist.
⚠️ Allocation Bases Selected Without Operations Agreement — Finance Builds a Model Nobody Believes
Finance configures allocation bases based on available data and reasonable assumptions. Headcount for HR, square footage for facilities, revenue for general overhead. The model runs. The output shows Production Department A carrying 65% of total overhead after allocation. Production Department A’s manager attends the management reporting meeting and challenges every line: “Why am I absorbing 65% of IT cost? My team uses the system for basic inventory transactions. The Sales department has 30 people doing order entry all day — why are they only allocated 20%?” Finance doesn’t have a good answer because the allocation base (headcount, in this case) doesn’t reflect actual IT consumption. The management P&L loses credibility before it’s been used for a single business decision.
Fix: Allocation bases need buy-in from both Finance and the operational leaders whose cost objects will absorb the allocated costs. Before finalizing bases, present the proposed allocation methodology to the department heads who will receive overhead allocations, explain the basis, and give them an opportunity to challenge it with data. The conversation will be uncomfortable but productive. Allocation bases that operational managers understand and accept as reasonable produce management P&Ls that drive decisions. Bases that feel arbitrary produce defensiveness and rejection.
⚠️ Overhead Calculation Not Run Monthly — Management Reports Reflect Stale Allocations
The overhead calculation in Cost Accounting doesn’t run automatically. Finance must trigger it as part of the management close process. When it’s skipped — because the Cost Accounting close feels like extra work on top of the GL close, or because the Cost Accounting administrator left and the process wasn’t documented — management reports reflect prior periods’ allocations applied to current period actual costs. The result: a management P&L that shows current revenue and current direct costs but three-month-old overhead allocations. The report is internally inconsistent and the “fully-loaded profitability” numbers aren’t actually fully loaded. Nobody notices until an anomaly prompts someone to investigate the source data.
Fix: The Cost Accounting overhead calculation must be in the period-close checklist as an explicitly scheduled step — who runs it, what parameters are used, what the output is verified against before distribution. Document the process. The overhead calculation isn’t an optional enhancement step; it’s what makes the management P&L accurate. Without it, the module is producing partial output and the management reports are systematically wrong.
⚠️ Cost Accounting Ledger Not Reconciled to GL — Two Numbers for the Same Period
The Cost Accounting ledger is a separate ledger from the GL, but it is sourced from GL data — so the total costs in Cost Accounting before allocation should equal total costs in the GL for the same period and cost element mapping. When they don’t agree, it means either the import didn’t capture all GL accounts, the cost element mapping has gaps, or a GL posting happened after the Cost Accounting import ran for the period. Finance distributes the management P&L from Cost Accounting and the statutory trial balance from the GL. A board member who reviews both notices that total operating expense in the management report is $180K lower than total operating expense in the GL. The question asked is which number is right. The answer requires investigating why two reports from the same ERP system show different total costs for the same period.
Fix: Build a reconciliation step into the management close process — after the overhead calculation runs, pull total costs by primary cost element from Cost Accounting and compare to total costs by corresponding GL account from the trial balance. Any difference requires investigation before management reports are distributed. The reconciliation doesn’t need to be complex — a simple comparison table produced as part of the close package — but it needs to happen every period.
Do This / Don’t Do This
✓ Do This
- Define target management P&L reports before configuring Cost Accounting — work backward from the output
- Involve operational leaders in allocation base selection — bases need their buy-in to be credible
- Run overhead calculation monthly as a required step in the management close checklist
- Reconcile Cost Accounting totals to GL trial balance before distributing management P&L
- Maintain separate costing versions for actual, budget, and forecast
- Use secondary cost elements for allocated overhead — clearly distinguishes direct vs. allocated cost
- Document every allocation policy — basis, source cost object, target cost objects, rationale
- Review allocation bases annually — consumption patterns change and bases should reflect current reality
- Train management P&L users on what “allocated overhead” means so they can interpret variances correctly
✗ Don’t Do This
- Configure Cost Accounting without first defining what management reports it needs to produce
- Select allocation bases based on data availability rather than economic reality of consumption
- Skip the overhead calculation during management close because “it’s extra work”
- Distribute management P&L without reconciling it to the GL for the same period
- Set allocation bases without operational leader input — credibility depends on buy-in
- Let Cost Accounting configuration drift from documented allocation policies without a change control process
- Assume Cost Accounting is a set-it-and-forget-it module — it requires active maintenance as cost structures evolve
Up Next:
Cost Accounting produces the management P&L. Budget Control makes sure actual spending doesn’t exceed the numbers in the plan without appropriate authorization. Next post: Budgeting and Budget Control in D365 F&O — budget models and planning worksheets, budget control configuration, encumbrance accounting, budget registers, and the configuration decisions that determine whether “over budget” is a warning Management reviews or a hard stop the system enforces before a purchase order is created.
Until then — define your management P&L mock-up first, secure operational buy-in on allocation bases, and reconcile Cost Accounting to the GL before every management report goes out.
— Bobbi
D365 Functional Architect · Recovering Controller
Leave a Reply