

Financial Reporter (Management Reporter), row definitions, column layouts, reporting trees, dimension filtering, and the gap between having accurate data in your system and having reporting infrastructure that turns that data into decisions.
The Reporting Landscape in D365 F&O — What Tool Does What
D365 F&O has multiple reporting surfaces, and the confusion about which one to use for which purpose is real and understandable. Let me lay out the landscape plainly before we go deep on any of it.
Financial Reporter (the current name for what most of the industry still calls Management Reporter) is the purpose-built financial statement tool — the one you use to build your income statement, balance sheet, statement of cash flows, and any other formatted financial statement. It connects directly to the D365 F&O general ledger, pulls from actual posted data, and produces formatted reports that can be reviewed in a browser, exported to Excel, or distributed as PDFs. This is the primary tool for formal financial reporting and the main subject of this post.
Financial Insights and Workspaces are the real-time analytical workspaces embedded in D365 F&O itself — the CFO Overview workspace, the Ledger Settlements workspace, the Budget Analysis workspace. These show live GL data, KPI tiles, and trend charts without leaving the application. They’re designed for daily monitoring and quick-look analysis, not for formatted board packages.
Power BI Embedded brings Power BI reports and dashboards directly into D365 F&O’s workspace pages. Microsoft ships pre-built Power BI content packs for finance, and organizations can build custom content. This is the path for visual executive dashboards, multi-company consolidated charts, and any reporting need that requires more visual flexibility than Financial Reporter provides.
Excel integration — via the Office Add-in for D365 — lets users pull live D365 data directly into Excel for ad hoc analysis, budget entry, and one-off reporting needs. This is a connected live query, not a static export, which means the data refreshes each time the worksheet updates.
For the formal monthly financial package — income statement, balance sheet, departmental P&Ls, budget versus actual comparisons — Financial Reporter is the right tool. Everything else serves complementary purposes. Get Financial Reporter working correctly first, then layer the others on top of solid data.
Financial Reporter: The Three Building Blocks
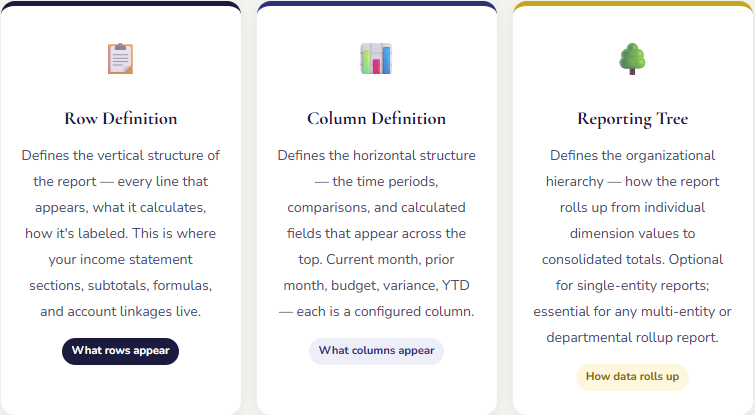
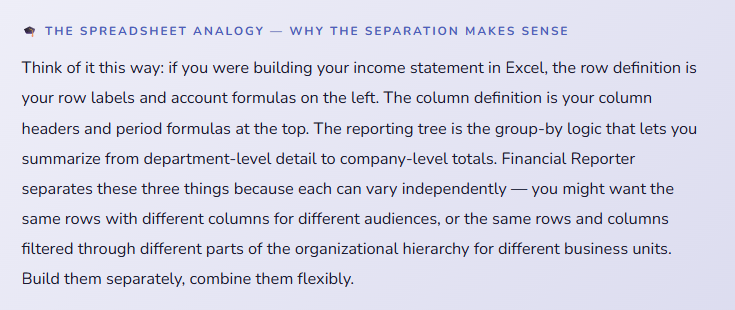
Every report in Financial Reporter is assembled from three components. You build each component separately, then combine them into a report definition. The separation is intentional — it means you can reuse the same row structure with multiple column layouts, or the same column layout across different reports, without rebuilding from scratch each time.
Building the Row Definition — The Most Important Step
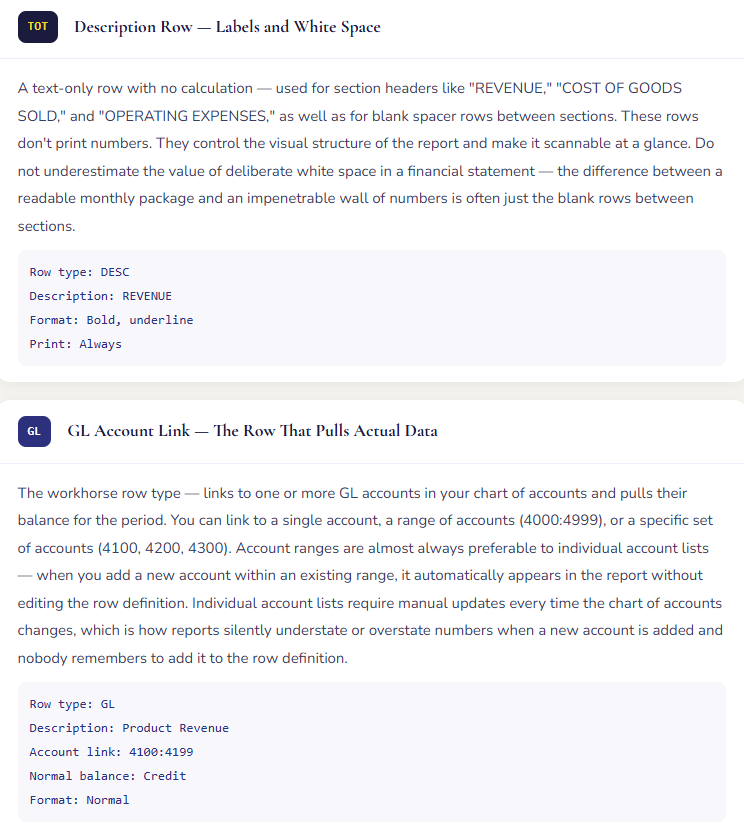
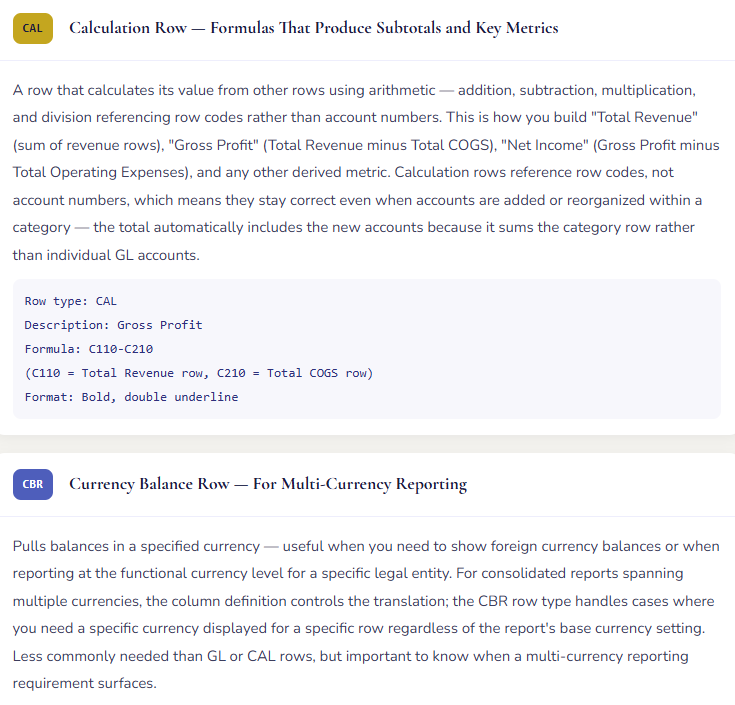
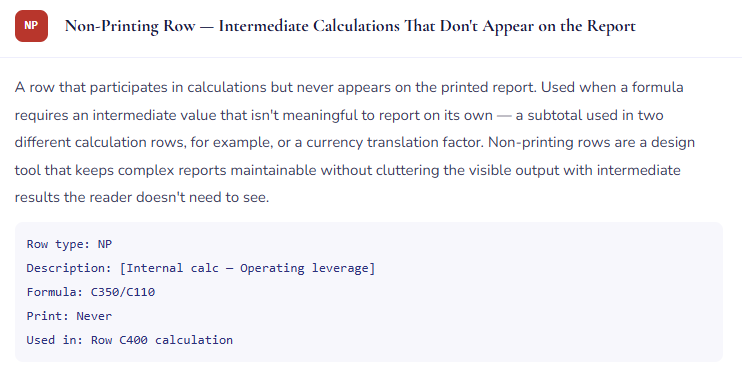
The row definition is where financial statement design lives. Every line on your income statement — every heading, every account-level detail row, every subtotal, every white space — is a configured row. This is not a drag-and-drop interface. It’s a structured spreadsheet-like setup where each row has a type, a description, a link to GL accounts or a formula, and formatting attributes. It takes time to build correctly. It’s worth every minute.
Column Definitions — Building the Comparison Your Leadership Needs
The column definition controls the horizontal axis of your financial statement — which time periods appear, how they compare to each other, and what calculated fields are shown. A well-designed column layout turns a static balance report into a decision-support tool. Here’s how to build one that actually serves the people reading it.
Each column has a column type — the most common being FD (Financial Data, pulling from the GL), CALC (a calculated column based on other columns), and DESC (a description column). Each FD column also has a book code that specifies which ledger to pull from (actual, budget, prior year) and a period modifier that defines the time period — current period, year-to-date, specific quarter, or a relative offset like “prior period.”
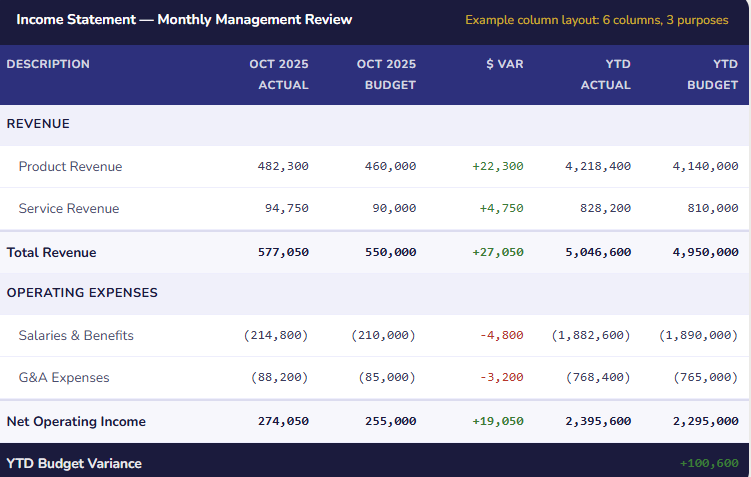
That six-column layout tells three stories simultaneously — how did we do this month versus plan, how are we tracking year-to-date versus the annual budget, and where specifically are we over or under. The same row definition. Three different analytical cuts, side by side, in a single report. This is what a well-designed column layout enables, and it’s not possible from a raw trial balance export or a GL summary report without significant manual manipulation.
Reporting Trees — The Feature That Makes Consolidation Possible
A reporting tree is the organizational hierarchy that Financial Reporter uses to consolidate data across legal entities, departments, cost centers, or any other dimension — and to generate reports at different levels of the hierarchy simultaneously. If row definitions and column definitions are the what and the when of financial reporting, reporting trees are the who and the where.
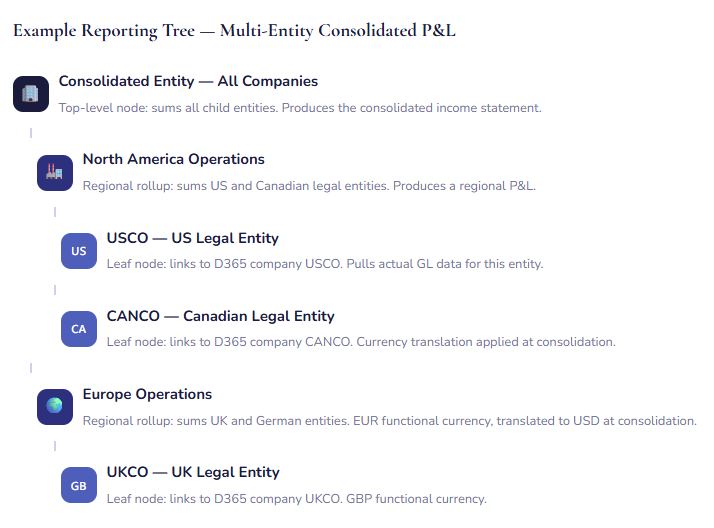
The power of the reporting tree is that a single report definition — one row definition, one column definition, one tree — can produce a consolidated income statement, a North America regional statement, a Europe regional statement, and individual entity statements, all from the same run. The only difference between each output is which node of the reporting tree the user selects when they generate the report. No separate report builds for each level of the hierarchy. No manual consolidation in Excel. One design, multiple views.
Reporting trees can also be built around dimensions rather than legal entities. A department reporting tree assigns dimension values to each leaf node — Marketing department, Sales department, Operations department — and the report pulls GL data filtered to that dimension value for each node. This is how you build departmental P&Ls that can be consolidated up to a company total without creating a separate report for each department.
Dimension Filtering — The Feature That Makes Segment Reporting Possible
Every Financial Reporter column can be filtered by one or more dimension values — business unit, cost center, product line, geography, project. This is what makes the same income statement structure useful for both the consolidated company view and the segment view: you run the same report with different dimension filters applied and get revenue and expense breakdowns by however you slice the business.
Dimension filtering in column definitions works through the Restriction field on each column — you specify which dimension values to include or exclude for that column. This can be done in the column definition directly (hardcoded to a specific dimension value), in the reporting tree unit (applied to all columns for that unit of the hierarchy), or as a report parameter that the user specifies at run time.
| Reporting Need | Approach in Financial Reporter | What Gets Built |
|---|---|---|
| Consolidated company P&L | No dimension filter — all dimensions included. Report shows total company results. | Single row/column definition, no tree or a simple single-node tree |
| Departmental P&L — all departments | Reporting tree with one node per department, each filtered to that department’s dimension value. Same row and column definition used across all nodes. | Row definition + column definition + department reporting tree. Run once, produces one report per department plus a rollup. |
| Single-department P&L | Column definition with dimension restriction to the specific department’s value. Can be a parameter entered at run time so one report definition serves multiple departments. | Row definition + column definition with dimension filter parameter. User specifies department at report generation time. |
| Multi-entity consolidated balance sheet | Reporting tree with one node per legal entity plus consolidation nodes. Intercompany eliminations handled through elimination entities or manual adjustment rows. | Balance sheet row definition + period-end column definition + multi-entity reporting tree. Currency translation configured at tree node level. |
| Budget vs. actual by business unit | Column definition with both actual and budget columns, dimension filter on both columns to the business unit dimension. Budget must be entered with the same dimension values to be filterable. | Row definition + column definition with dimension filters on each column. Requires budget data entered at the dimension level, not just account level totals. |
| Prior year comparative — entity level | Column definition with current year actual, prior year actual, and variance columns. Reporting tree handles entity selection. Prior year data must be available in D365 (requires keeping prior year data accessible, not archived). | Row definition + prior-year column definition + entity tree. Verify prior year data accessibility before promising this report to leadership. |
The Minimum Viable Reporting Set for Every F&O Implementation
Here’s the list of reports that should be built, tested, and signed off before go-live — not as optional enhancements, but as requirements. The financial modules you’ve been building all series produce data. These are the instruments that read it.
📊 Income Statement
Revenue, COGS, gross profit, operating expenses, and net income. Monthly management review column layout plus prior year comparison layout. Should reconcile to the trial balance net income line to the penny.
⚖️ Balance Sheet
Assets, liabilities, and equity at period end. Verify that total assets equals total liabilities plus equity on every run — an imbalanced balance sheet is a configuration error, not a rounding issue. Column layout: current period, prior period, change.
🏢 Departmental P&L
Income statement filtered or rolled up by department, cost center, or business unit dimension. Essential for management accountability. Requires consistent dimension coding on transactions — a gap in dimension data shows immediately in this report.
💰 Budget vs. Actual
Any income statement column layout that includes budget columns. Requires approved budget data entered in D365’s budget module at the appropriate dimension level. Without budget data in the system, this report produces actual columns and blank budget columns.
🌍 Consolidated P&L (if multi-entity)
Uses a reporting tree to consolidate across legal entities. For organizations with intercompany transactions, requires either intercompany elimination entities or documented manual adjustment processes. This report is where multi-entity currency translation rules get tested most visibly.
📈 Statement of Cash Flows
The hardest of the standard statements to build in Financial Reporter — it requires reclassification logic that maps GL accounts to cash flow categories (operating, investing, financing). Build it before the first audit, not during it. External auditors almost always request it in the first year.
The Other Reporting Tools — When to Use Them
Financial Reporter is the formal statement engine, but it’s not the right tool for every reporting need. Here’s how the other surfaces fit in.
The CFO Overview Workspace in D365 F&O gives finance leadership a live dashboard — revenue, expense, cash, AR, AP, and budget indicators updating in real time as transactions post. It’s designed for the 8 AM check-in, not the board meeting. Used daily as a monitoring habit, it surfaces anomalies early — a revenue line that looks off at day 10 of the period, a cash balance moving in an unexpected direction — that would otherwise surface only at month end. Train your CFO and Controller to use it. It costs nothing to enable and reduces end-of-period surprises meaningfully.
The Ledger Settlements workspace and the Trial Balance in the periodic reporting menus are for the controller’s close process — verifying that subledgers tie to the GL, that dimension data is complete, and that the accounts are clean before Financial Reporter reports are generated. Think of these as the quality control layer that precedes the formatted reporting layer. You should run a trial balance reconciliation before you trust your Financial Reporter output, not after you’ve distributed it to leadership.
The Power BI content packs for Finance that Microsoft ships with D365 F&O include pre-built dashboards for financial performance, budget analysis, and ledger activity. These are worth reviewing at implementation — some organizations find them close enough to their needs to use as-is or with minor customization, which saves significant Power BI development time. Others find them too generic and prefer to build custom content. In either case, they’re a starting point, not a finished product.
The Mistakes That Produce Reports Nobody Trusts
⚠️ Reporting Left as a Phase 2 Item — Finance Builds Income Statements in Excel at Month End
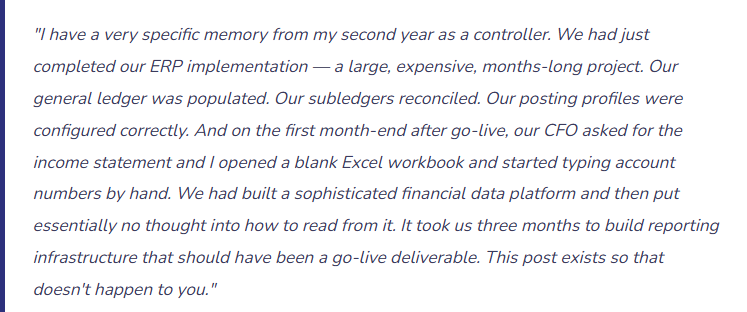
This is the most common and most expensive Financial Reporter mistake — not a configuration error, but a sequencing error. Financial Reporter setup gets deprioritized during the go-live sprint in favor of transaction testing and data migration, with the understanding that “we’ll build reports after go-live.” After go-live, the close has to happen. With no reports built, Finance exports a trial balance to Excel and builds the income statement by hand, just like before. The pattern repeats for three, six, twelve months — and each month the Excel-based report gets a little more customized, a little more complex, and a little harder to replace with the system report that should have been built in the first place.
→ Put Financial Reporter report development on the implementation project plan as a deliverable with a go-live date requirement, not a post-go-live enhancement. Assign it to the finance team member who will own it operationally — not a consultant who will be off the project before the first close. Plan three to four weeks for an experienced person to build, test, and refine the initial reporting suite. Block time for it in the pre-go-live schedule the same way you would for integration testing.
⚠️ Income Statement That Doesn’t Tie to the Trial Balance
A Financial Reporter income statement that shows a net income number different from the net income on the trial balance has an error in the row definition — a missing account range, a misconfigured formula, an account that was moved in the chart of accounts without a corresponding row definition update. The problem is that this error is invisible unless someone explicitly reconciles the two. If leadership receives a monthly income statement and nobody has verified that the net income figure matches the GL, the report could be materially wrong without anyone knowing. I have seen this happen. The discovery, after several months of distribution, is not a comfortable conversation.
→ Add “Reconcile Financial Reporter net income to trial balance net income” to your monthly close checklist as a required step before any report is distributed. It takes five minutes. The comparison is: net income per income statement equals the net balance in the retained earnings/current year earnings accounts on the trial balance. If they don’t agree to the penny, the row definition has a gap. Find it before the report goes out, not after.
⚠️ Budget Data Not in the System — Budget vs. Actual Column Shows Zeros
The most useful column in a management report is the budget variance column. It requires budget data to be entered in D365 F&O’s budget module — at the account level, with the appropriate financial dimensions, for each period of the budget year. When this hasn’t been done, the budget column in Financial Reporter is blank. Variance is zero by definition. The report is less useful than a simple actuals-only statement, because it implies a zero budget rather than making clear that no budget was entered. Finance teams that distribute reports with blank budget columns frequently receive questions from leadership about whether the system is working correctly — it is; the budget data just isn’t there.
→ Enter the approved annual budget in D365 F&O before the first period of the budget year opens. This means the budget process needs to be complete and the final numbers approved before year-end — which is a planning process discipline question as much as a system question. If the budget is finalized in Excel, it can be imported into D365 in bulk using the budget import template. The import takes hours. The reporting benefit runs for twelve months.
⚠️ Dimension Data Gaps — Department Reports With Significant Unallocated Balances
A departmental P&L built on inconsistent dimension coding is worse than no departmental P&L, because it gives the false impression of complete data while actually showing only the transactions that happened to be coded correctly. When Finance runs the first departmental report and finds that 30% of operating expenses show no department assignment — because some AP invoices were posted without dimension values, or because the AP team codes dimensions inconsistently — the report is not useful for management accountability. And when Finance presents it anyway with a caveat that “30% is unallocated,” that caveat erodes confidence in the reporting system more broadly.
→ Configure dimension values as required fields on the GL accounts where departmental reporting matters — operating expense accounts especially. F&O will prompt for a dimension value before any transaction posts to those accounts, preventing the silent gap from accumulating. Pair this with clear training for everyone who posts transactions. And accept that the first period after implementing required dimensions will generate user friction — that friction is the sound of the prior data quality problem being corrected in real time.
⚠️ Reports Designed for the Person Who Built Them, Not the Person Who Reads Them
This is the softest mistake on the list and the one I see most consistently. A Financial Reporter income statement built by a finance person who lives in the GL every day will have row labels that make sense to a finance person who lives in the GL every day. “Net Revenue — Product Line A (4100:4199)” tells the accountant exactly what the row contains. It tells the VP of Sales absolutely nothing. The same phenomenon appears in balance sheet categorization, in expense groupings, in which subtotals are shown and which are omitted. The person who built the report and the person who reads the report have completely different information needs, and the report serves only one of them.
→ Show draft reports to the intended audience — the person who will present the monthly package, the department head who will read their departmental P&L — before they’re finalized. Ask where they get confused. Ask what they need to see that they can’t find. Ask what appears on the report that they don’t need. The redesign that results from one forty-five minute conversation with the actual audience produces a report that gets used instead of ignored. That’s the measure of reporting success.
Quick Reference: Do’s and Don’ts
✓ Do This
- Build your Income Statement, Balance Sheet, and Departmental P&L as go-live deliverables — not Phase 2
- Use account number ranges in row definitions, not individual account lists
- Reconcile Financial Reporter net income to the trial balance before every distribution
- Enter approved annual budgets in D365 F&O so budget columns are populated from day one of the budget year
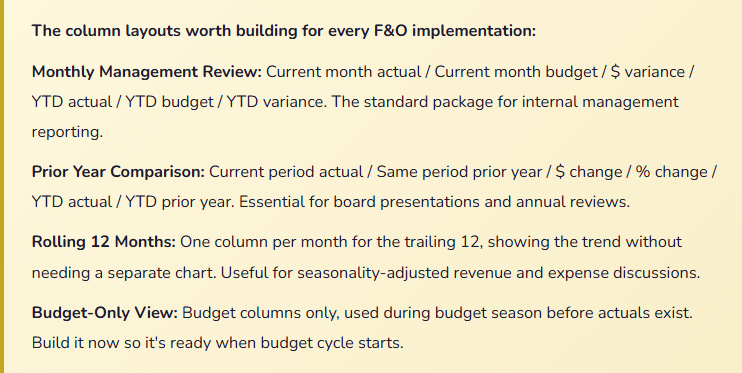
- Build at minimum two column layouts: monthly management review and prior year comparison
- Use reporting trees for any multi-entity or multi-department consolidation requirement
- Configure dimension values as required on accounts where departmental reporting matters
- Show draft reports to the people who will read them, not just the people who built them
- Verify that balance sheet total assets equals total liabilities plus equity on every run
- Build the Statement of Cash Flows before the first audit, not during it
- Train the finance team member who will own Financial Reporter operationally — not just during implementation
- Use the CFO Overview Workspace for daily monitoring and reserve Financial Reporter for formal reporting
✗ Don’t Do This
- Defer reporting setup to Phase 2 and plan to build month-end reports manually in the interim
- List individual account numbers in row definitions — ranges are more maintainable
- Distribute a Financial Reporter income statement without reconciling to the trial balance first
- Leave budget columns blank because the budget “lives in Excel” — import it into D365
- Build a single column layout and expect it to serve every reporting audience
- Design reports for the person who built them — design them for the person who reads them
- Assume that an imbalanced balance sheet is a rounding issue — it’s always a configuration error
- Deploy dimension-based reporting without first ensuring consistent dimension coding on transactions
- Ignore the CFO Overview Workspace — it surfaces problems early when used as a daily habit
- Accept “Financial Reporter is being replaced by Power BI” as a reason to skip building formal statement reports
- Change account numbers in the chart of accounts without updating the row definitions that reference them
- Build consolidated reports without confirming intercompany elimination logic
The honest reflection from fourteen years on both sides of this work: financial reporting is the output that everything else in a D365 implementation is designed to support. The chart of accounts design, the posting profiles, the dimension structure, the AP and AR processes, the procurement controls, the fixed asset configuration — all of it is infrastructure that exists to produce numbers. Financial Reporter is what turns those numbers into information that drives decisions.
When it works well, leadership receives a monthly package they trust, reads without assistance, and uses to make decisions. When it doesn’t work — when reports are late because they’re being manually assembled, when they don’t tie to the trial balance, when the department analysis is 40% unallocated — the entire downstream value of the implementation is diminished. The reporting infrastructure is not the glamorous part of the project. But it’s the part that everyone will judge the success of the project by, every month, for years to come. Give it the time it deserves.
Up Next:
We’ve built the financial foundation, configured the modules, and set up the reporting infrastructure. Now it’s time to talk about the process that brings it all together every four weeks: Period Close and Month-End in D365 F&O — the close checklist, ledger period management, the sequence that matters, the controls that protect your periods from after-the-fact changes, and how to build a close process that runs predictably without heroics. If you’ve ever worked a month-end where something different went wrong every cycle, this post is the one to share with your team.
Until then — reconcile your Financial Reporter output to the trial balance, enter your budget in D365 so the variance column means something, and show your draft income statement to the person who presents it at the board meeting before you call it done.
— Bobbi
D365 Functional Architect · Recovering Controller
Leave a Reply