

How BC’s Cost Accounting module differs from financial accounting, the cost type, cost center, and cost object structure Finance configures, how costs transfer from the GL, the internal management reporting it enables, and why Finance teams that ignore it end up building in Excel what BC already does natively.
Financial Accounting vs. Cost Accounting—Why They Are Two Separate Things
BC’s financial accounting module records transactions for external reporting: every posting creates GL entries that roll up to the balance sheet, income statement, and trial balance used for GAAP financial statements and tax filings. The chart of accounts, posting groups, and periods are all designed around external reporting requirements.
Cost accounting serves a different purpose: internal management analysis of how costs are incurred and consumed across the organization’s cost centers, business units, and product lines. The cost accounting layer in BC is a parallel structure that receives a copy of GL entries, re-categorizes them into cost types, distributes them across cost centers and cost objects using allocation rules, and produces internal management reports that the external financial statements never need to show.
- Financial Accounting (GL)
- Purpose: external reporting—GAAP statements, tax filings, audit.
- Structure: chart of accounts, posting groups, fiscal periods.
- Audience: auditors, tax authorities, lenders, investors.
- Transactions post directly; no allocation logic applied.
- Entries are permanent; reversals create additional entries.
- Cost Accounting (BC Module)
- Purpose: internal management analysis—departmental P&L, overhead allocation, cost object profitability.
- Structure: cost types, cost centers, cost objects, allocation keys.
- Audience: Controllers, CFOs, department managers, operations leadership.
- Costs flow from GL, then are redistributed by allocation rules.
- Allocation entries exist only in the cost accounting layer; they do not affect the GL.
The critical architectural point: cost accounting allocations never touch the GL. When Cost Accounting allocates $42,000 of facilities overhead from a shared cost center to three operating departments, no GL entries are created. The GL still shows the $42,000 in the original facilities account. The cost accounting layer shows it distributed across the three departments according to the allocation key. This means cost accounting reports and GL reports will always show different numbers for the same cost—by design. Finance must understand this separation to explain the difference to department managers who wonder why their cost accounting report does not match the GL detail they can pull themselves.
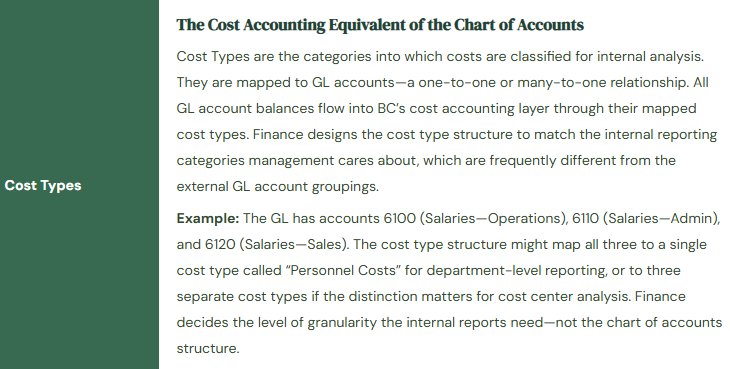
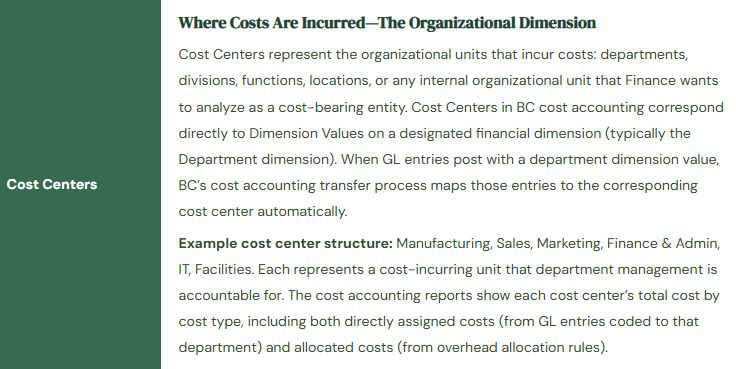
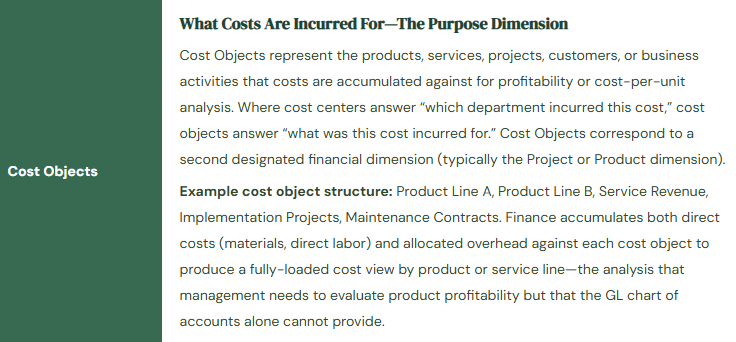
The Three-Object Structure: Cost Types, Cost Centers, Cost Objects
How Costs Transfer from the GL to Cost Accounting
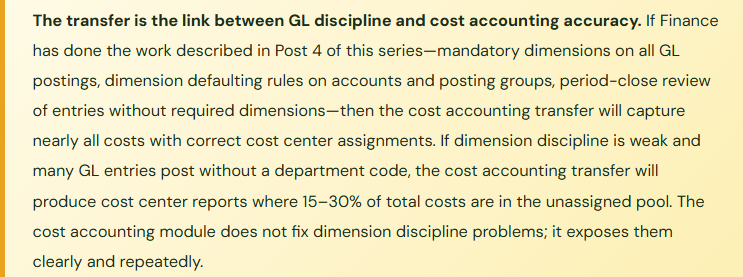
BC moves costs from financial accounting into the cost accounting layer through a transfer process that Finance runs periodically (daily, weekly, or monthly depending on the reporting cadence needed). The transfer reads GL entries posted since the last transfer, maps them to cost types via the Cost Type–GL Account link, assigns them to cost centers via the Dimension Value–Cost Center link, assigns them to cost objects via the Dimension Value–Cost Object link, and writes the corresponding cost accounting entries.
The transfer only captures what the GL entries know. An entry that posted to account 6100 with no department dimension assigned will transfer to the cost type mapped to account 6100, but with no cost center—it lands in the unassigned cost pool. An entry with a department dimension value that has no corresponding cost center mapping is also unassigned. The unassigned cost pool is the first thing Finance should check after every transfer: any significant amount in the unassigned pool indicates either a missing dimension on a GL posting or a missing cost center mapping. Left unaddressed, the unassigned pool grows into a cost sink that makes the cost center reports untrustworthy.
Allocation Keys—Distributing Shared Costs Across Cost Centers
Some costs belong to no single cost center in the initial GL posting: facilities rent, IT infrastructure, utilities, executive management salaries. These shared costs post to a “shared services” or overhead cost center in the GL. Cost accounting’s allocation function distributes them to the operating cost centers that benefit from the shared resource, using an allocation base (the “key”) that Finance defines.
| Cost to Allocate | Allocation Base (Key) | Why This Base | Finance Maintenance |
|---|---|---|---|
| Facilities & Rent | Square footage by department | Each department’s cost burden is proportional to the floor space it occupies—the most defensible basis for space-related costs. | Update annually or when space assignments change. Facilities manager provides the square footage data. |
| IT Infrastructure | Headcount by department | IT infrastructure scales roughly with the number of users supported. Headcount is a simple, auditable proxy for IT consumption. | Update monthly from HR headcount report. Automation via Power Automate is feasible for larger companies. |
| Executive & Corporate Overhead | Revenue by cost object or operating cost by cost center | Corporate costs serve all business activities; allocating proportional to revenue or operating size reflects economic benefit. | Update annually or at each budget cycle. The allocation percentage should reflect a defensible attribution logic documented for management. |
| HR Function Costs | Headcount or FTE by department | HR service consumption is proportional to the number of employees in each department. | Update monthly with headcount. Keep the allocation base consistent year-over-year for trend comparability. |
| Finance Function Costs | Transaction count or revenue by cost center | Finance service consumption scales with business activity. Transaction count is more granular; revenue is simpler to maintain. | Transaction count requires pulling from BC report data; revenue-based allocation is often preferred for simplicity and management acceptance. |
Allocation rules in BC are configured under Cost Accounting → Cost Allocation. Each rule specifies: the source cost center and cost type(s) being allocated, the target cost centers (and optionally cost objects) receiving the allocation, the allocation base type (static percentage, dynamic based on a BC data source, or manually entered amounts), and the allocation period. BC can calculate dynamic allocations using actual BC data—for a headcount-based allocation, BC reads the number of employees in each department from BC’s HR module if available. Static allocations use percentages Finance enters manually and updates on the maintenance schedule.
The Internal Reports Cost Accounting Produces
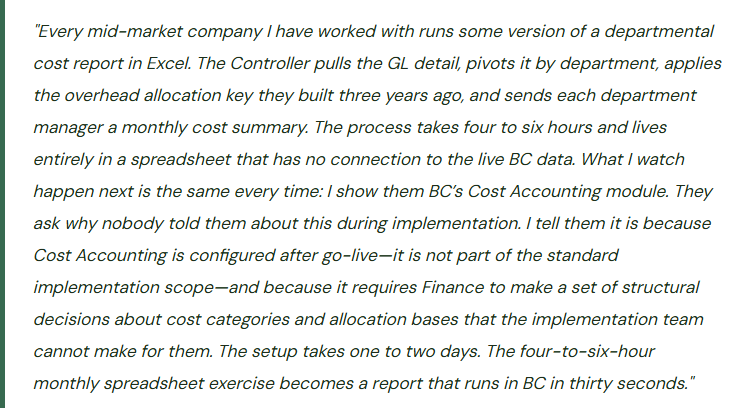
Once costs are transferred and allocations are run, BC’s Cost Accounting module produces three categories of internal reports that Financial Accounting alone cannot generate. Cost Center statements show total costs by cost type for each cost center, including both directly assigned costs and allocated shared costs—the departmental P&L that shows each department manager the full cost of running their function, not just the costs coded directly to their department. Cost Object reports show the fully loaded cost per product line, service category, or project—the profitability analysis by business activity that requires allocating overhead to understand margin after all costs are accounted for. Budget vs. actual cost reports compare actual costs transferred into the cost accounting layer against the cost accounting budget, by cost center and cost type, producing the variance analysis for each department manager’s monthly review.
Five Cost Accounting Mistakes That Keep Finance in the Spreadsheet
⚠️ Unassigned Cost Pool Grows Unchecked—Cost Center Reports Are Missing 25% of Costs
The cost accounting transfer runs monthly. Finance never checks the unassigned cost pool after each transfer. Over eight months, $218,000 of costs have transferred without a cost center assignment because the posting dimension was either missing or mapped to a dimension value that has no corresponding cost center. The cost center P&L reports show each department’s costs, but the totals across all cost centers are $218,000 less than the total costs in the GL for the same period. Department managers are making resourcing decisions based on cost center reports that do not reflect the full cost burden of their departments—they have no way of knowing 25% of the costs attributable to them are sitting in an unassigned pool Finance has not investigated.
Fix: Check the unassigned cost pool immediately after every cost accounting transfer. The unassigned pool balance must be zero or near-zero before cost center reports are distributed. Any meaningful unassigned balance requires investigation: identify the GL entries that transferred without a cost center assignment, trace them to their source transaction, determine whether the missing dimension is a user coding error or a missing cost center mapping, and correct it. For recurring entries that consistently post without a dimension (payroll journal, depreciation, standard accruals), configure dimension defaulting rules in BC so those entries always get the correct department code. The unassigned pool check is a monthly close procedure, not an optional review.
⚠️ Allocation Keys Are Set Up Once and Never Updated—Headcount Has Changed Significantly
The IT infrastructure allocation key was configured at go-live using headcount percentages that reflected the organization’s structure at that time: Manufacturing 45%, Sales 25%, Finance & Admin 20%, IT itself 10%. Over two years, the company grew the Sales team from 8 to 22 people while Manufacturing headcount stayed flat. The allocation key was never updated. IT costs continue to be allocated on the original percentages. Manufacturing receives 45% of IT overhead despite having 22% of total headcount. Sales receives 25% of IT overhead despite having 44% of total headcount. Manufacturing managers consistently push back on their cost center reports, arguing their costs are too high relative to their business activity, but without knowing the allocation key is the source of the discrepancy.
Fix: Allocation keys must be reviewed and updated on a documented schedule. For headcount-based allocations, review and update at each annual budget cycle and whenever a significant headcount event occurs (a major hiring class, a reduction in force, a division reorganization). For square footage-based allocations, review annually and when space assignments change. For revenue-based allocations, review quarterly if revenue mix shifts materially between cost objects. The allocation key maintenance schedule should be written into the Finance procedures manual. Each allocation key should have a last-reviewed date and a next-review date documented. Unchanged allocation keys that were set up at implementation are among the most common sources of cost center report credibility problems in mid-market companies.
⚠️ Cost Types Are Too Granular—Department Managers Cannot Read the Reports
The Controller designs the cost type structure during implementation with 68 cost types, mirroring the GL chart of accounts almost one-for-one. The resulting cost center P&L reports have 68 line items for each department. Department managers receive a 68-line cost report every month and immediately stop reading it because the level of detail exceeds what they can act on. Finance continues sending the reports. Department managers continue not reading them. After six months, department managers ask Finance to “send the Excel version” because it is easier to look at. Finance sends the Excel export. The cost accounting module investment has produced a report that is less useful than a simpler summary because the cost type structure was designed to satisfy Finance’s analytical curiosity rather than management’s decision-making needs.
Fix: Design the cost type structure from the department manager’s perspective, not from the GL account perspective. The question to answer: what cost categories does a department manager need to see to understand and manage their cost center? For most mid-market companies the answer is 8–15 categories: Personnel, Benefits & Payroll Taxes, Travel & Entertainment, External Services, IT Costs, Facilities Allocation, Marketing & Advertising, Training, Equipment & Supplies, Depreciation, Corporate Allocation, and two or three industry-specific categories. Anything more granular than what the manager will act on belongs in the GL detail that Finance can drill into when needed, not in the summary report that lands in the manager’s inbox every month. Conduct a one-meeting workshop with two or three department managers before finalizing the cost type structure to validate that the categories make sense to the people who will receive the reports.
⚠️ Cost Accounting Transfer Is Run Annually at Year-End—No In-Year Departmental Cost Visibility
The cost accounting module was configured during implementation. The implementation partner ran a test transfer and the reports looked correct. Finance decided to run the actual transfer annually at fiscal year-end to produce the full-year departmental cost analysis for the annual management review. For eleven months of the year, department managers have no cost accounting reports. They manage against the GL detail, which does not include overhead allocations and therefore understates their true cost burden. At year-end, Finance runs the annual transfer and allocation, produces the departmental cost summary for the annual review, and every department manager is surprised by their fully-loaded cost total because they spent the year looking at partial costs. The cost accounting module is a year-end reporting tool rather than the monthly management tool it was designed to be.
Fix: The cost accounting transfer should run monthly, immediately following the GL period close when the month’s postings are complete. The allocation run follows the transfer. Cost center reports are distributed with the rest of the monthly management package—same cadence as the income statement and balance sheet. Department managers who receive cost accounting reports monthly can identify cost trends, investigate unexpected increases, and manage within their cost center budget in real time. A year-end cost accounting report is archaeology; a monthly cost accounting report is a management tool. The monthly transfer and allocation run takes 15–30 minutes once the initial configuration is complete.
⚠️ Cost Accounting and GL Reports Are Presented Together Without Explaining the Structural Difference—Management Is Confused by Different Numbers
Finance distributes the monthly management package with the GL income statement on page 2 and the cost accounting departmental summary on page 3. The Sales department’s total cost on the cost accounting report is $340,000 for the month. The Sales department’s total cost in the GL (sum of all entries with department dimension = Sales) is $228,000 for the same month. A senior leader asks Finance to explain why the same department has two different cost totals. Finance does not have a ready answer because nobody on the team was involved in the cost accounting configuration and nobody understands that the $112,000 difference is the overhead allocation that exists only in the cost accounting layer. The leader concludes that Finance has a reporting accuracy problem and asks IT to investigate. IT investigates for a week and finds no data error. The trust damage from a week of unexplained discrepancy between two Finance reports is not recovered quickly.
Fix: Every management report package that includes both GL-based and cost-accounting-based reports must include a clear explanatory note: “Cost center reports include allocated overhead costs that do not appear in the general ledger detail. The difference between the cost center total and the GL department total represents shared costs (facilities, IT, corporate functions) allocated to this department based on [allocation key]. The GL total reflects only costs directly coded to this department.” The first time cost accounting reports are distributed to department managers, Finance should conduct a brief walkthrough—30 minutes—explaining what cost accounting reports show, why they differ from GL reports, what the allocation keys are, and how managers should use the reports for cost management. Unexplained numerical differences in Finance reports are a trust problem, not a technical problem.
Do This / Don’t Do This
Do This
- Check the unassigned cost pool after every transfer—it must be zero or near-zero before reports are distributed
- Design cost type structure from the department manager’s perspective: 8–15 actionable categories, not 68 GL account mirrors
- Run the cost accounting transfer and allocation monthly, not annually
- Review and update allocation keys on a documented schedule—at minimum annually, and after any significant headcount or space event
- Include an explanatory note in every management package that includes both GL and cost accounting reports
- Conduct a walkthrough with department managers the first time cost accounting reports are distributed
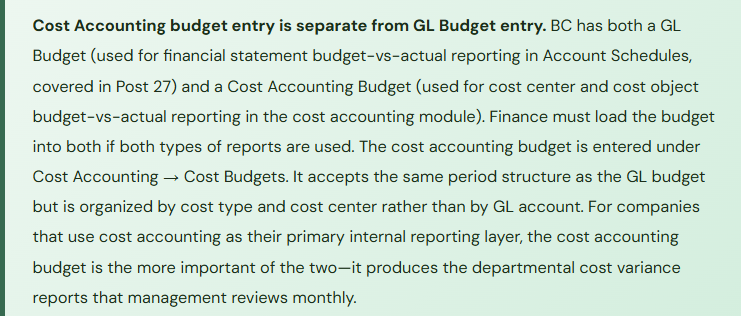
- Load the annual budget into the Cost Accounting Budget separately from the GL Budget if cost center budget-vs-actual reporting is needed
- Fix dimension discipline in the GL first—cost accounting exposes missing dimensions immediately and repeatedly
Don’t Do This
- Let the unassigned cost pool accumulate between monthly transfers without investigation
- Mirror the GL chart of accounts in the cost type structure—68 cost types produce reports nobody reads
- Set allocation keys at go-live and never update them as the organization changes
- Run the transfer annually at year-end and call cost accounting a reporting tool—it is a monthly management tool
- Present GL reports and cost accounting reports side-by-side without explaining why they show different department totals
- Configure cost accounting before fixing dimension coding discipline in the GL—bad dimensions produce a bad unassigned pool that undermines all cost center reports
- Continue maintaining the departmental cost Excel spreadsheet in parallel with cost accounting once BC is configured and validated
Up Next:
Cost accounting closes the internal reporting arc. The next post moves to a revenue model that is reshaping how mid-market companies structure their BC implementation from the start: Subscription and Recurring Revenue in Business Central—how BC handles recurring invoicing natively, the deferred revenue setup Finance must own, the configuration decisions for subscription-based businesses, the revenue recognition timing controls, and why the Finance team that configures this correctly in BC never needs to maintain a separate subscription tracking spreadsheet again.
— Bobbi
D365 Functional Architect · Recovering Controller
Thank you for reading!
If this post helped you solve a real problem, share it with a Finance colleague who is in the middle of an ERP implementation or a post-go-live optimization. If you have a topic that I haven’t covered, please reach out. There is always one more post worth writing.
If you are interested in learning more, here are some of my recent posts:
- AI and ERP Security: What Copilot Means for Your D365 Security Roles and Internal Controls
- The Natural Language ERP: Stop Running Reports, Start Asking Questions
- AI Adoption in ERP: Why Change Management Is Your Most Critical AI Investment
- Agent 365: Microsoft’s Control Tower for All Your ERP Agents
- AI in D365 Supply Chain: From Demand Planning to Warehouse Intelligence
Leave a Reply