

Connecting Business Central to Power BI, the BC connector and its trade-offs, which questions belong in native BC reporting vs. a dedicated BI layer, building dashboards Finance and Operations can actually use, and the data freshness conversation every team needs to have before the first dashboard goes live.
The BC Reporting Landscape — Four Tools, Four Different Jobs
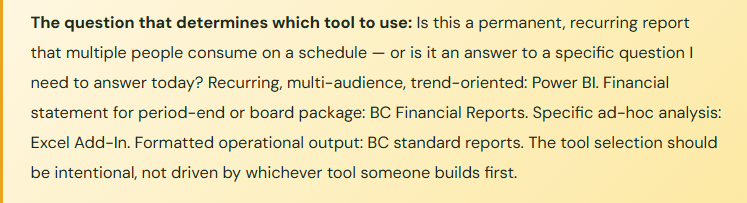
Business Central doesn’t have one reporting tool. It has four distinct reporting capabilities, and the right choice for any given reporting need depends entirely on what you’re trying to produce — not on which tool someone is most comfortable with. The most common reporting mistake I see in BC implementations isn’t a configuration error; it’s asking the wrong tool for the wrong output.
📋 BC Financial Reports
Row definitions, column definitions, account schedules. The native financial statement tool — income statement, balance sheet, cash flow. Live data, drill-down to GL entries, budget vs. actual columns. Runs in BC, stays in BC.
Use for: period-end financial statements, budget vs. actual, management P&L
📊 Power BI
Microsoft’s dedicated analytics layer. Connects to BC via the BC connector or API. Handles trend analysis, cross-entity comparison, operational KPIs, and visualizations BC’s native reporting can’t produce. Data is refreshed on a schedule — not real-time.
Use for: trend dashboards, operational KPIs, cross-functional analytics, executive scorecards
📑 Excel with BC Add-In
Live, query-based connection to BC data from Excel. Pull BC data into Excel for ad-hoc analysis, custom layouts, and one-off reporting that doesn’t justify a Power BI build. Refreshes on demand. Connects to BC’s OData feeds through the Excel Add-In.
Use for: ad-hoc financial analysis, custom reports needed once or twice, pivot analysis on BC data
🖨️ BC Standard Reports (RDLC)
Built-in operational reports — aged receivables, trial balance detail, item sales statistics, vendor ledger entries. Formatted, printable. Run from within BC. Many are directly printable to PDF for audit or operational use. Can be customized in AL extension development.
Use for: operational inquiries, printed documents, audit support, period-close detail
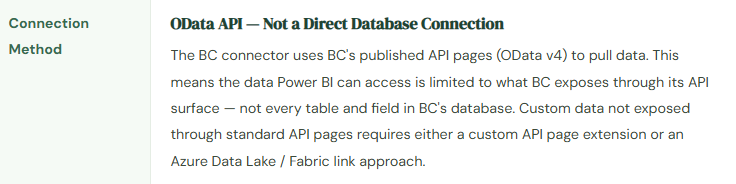
The BC Power BI Connector — What It Does and What It Doesn’t
Business Central ships with a built-in Power BI connector and a library of pre-built Power BI report packs that embed directly into BC workspaces. When you open the Finance workspace in BC, the embedded Power BI report in the FactBox pane is coming from this integration. For many small and mid-sized BC organizations, this is their first exposure to Power BI — and it’s a genuinely good starting point.
BC Power BI Connector — Key Facts Finance Must Know
What Belongs in BC vs. What Belongs in Power BI
This is the decision that determines whether your reporting investment ends up used or unused. The tendency I see in early BC implementations is to try to make Power BI do everything — including things BC’s native Financial Report builder does better. And the opposite happens too: Finance builds elaborate account schedules in BC’s Financial Report builder for operational metrics that Power BI would handle in a fraction of the time.
| Reporting Need | Best Tool | Why |
|---|---|---|
| Monthly income statement with budget vs. actual | BC Financial Reports | Native financial report builder handles account ranges, subtotals, variance columns, and drill-down to GL entries. Lives where Finance works. Doesn’t require Power BI licensing for viewers who only need the P&L. |
| Revenue trend over 24 months by customer segment | Power BI | Time-series trend analysis with multi-dimensional slicing is exactly what Power BI is designed for. BC Financial Reports can produce a 24-month comparison but with significantly more setup effort and no interactive slicing capability. |
| AR aging for collections meeting | BC Standard Report (Aged AR) | The built-in Aged Receivables report in BC is formatted, accurate, and drill-able. No development required. Printing to PDF for a collections meeting takes 30 seconds. Building a Power BI version of a standard BC report creates maintenance overhead for zero functional improvement. |
| Gross margin by item category across all customers | Power BI | Cross-dimensional profitability analysis combining sales, COGS, and customer/item dimensions in an interactive visual requires Power BI’s data model. BC’s standard reporting can approximate this but not with interactive drill-down and visual slicing. |
| Inventory on hand by location, item, and vendor | BC (inquiry) or Power BI (trend) | Current on-hand inventory: BC’s inventory inquiries and standard reports are better — they’re live. Inventory trend over time or inventory turns ratio analysis: Power BI handles the historical pattern analysis that BC inquiry screens don’t visualize. |
| Executive one-page financial dashboard for leadership | Power BI | A visually designed KPI dashboard with revenue, gross margin, operating expense, cash position, and AR aging — all on one screen with color-coded variance indicators — is Power BI’s native use case. The audience is leadership, not Finance. Power BI’s visual design capability exceeds what BC’s native reports can produce. |
| Trial balance for auditors | BC Financial Reports or standard report | Auditors want a trial balance that ties to the GL — and they want it from the system of record. Power BI is not the system of record. The trial balance should come from BC directly. A Power BI version of the trial balance is a downstream report of a report, not source data. |
Designing Dashboards That People Actually Use
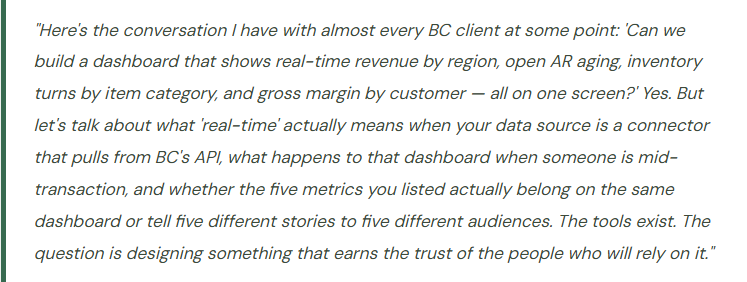
The most common Power BI failure mode isn’t technical — it’s that dashboards get built, delivered, and then not used because they don’t answer the questions the audience actually asks. Before building anything, Finance needs to answer three questions for each planned dashboard: Who is the audience? What decision does this dashboard support? What would they do differently if the dashboard showed a number outside the expected range?
Four Mistakes That Produce Dashboards Nobody Trusts
⚠️ Building Power BI Before Cleaning the BC Data — Dashboards Surface Problems, Not Answers
Power BI is deployed six months after BC go-live. The team builds a gross margin by customer dashboard. The first time leadership reviews it, three major customers show negative gross margin — which seems wrong. Investigation reveals that the items sold to those customers have incorrect standard costs in BC, and the cost ledger has been carrying wrong costs since go-live. The dashboard didn’t create the problem — it revealed it. But the reaction from leadership is “the dashboard is wrong” rather than “the data is wrong.” Trust in the dashboard is damaged before it ever had a chance to be useful.
Fix: Validate BC data quality before deploying Power BI dashboards. The most important pre-Power BI data checks: item costs reconcile to vendor invoices, customer and vendor master data is complete and correctly classified, dimensions are consistently applied to transactions. A dashboard built on clean data earns trust immediately. A dashboard built on dirty data surfaces the data problems in the most visible way possible — in front of the audience you most need to trust it.
⚠️ Using Power BI for the Financial Statement Close — Wrong Tool for the Audit Trail
Finance starts producing the monthly income statement from Power BI because the visual design is better than BC’s Financial Report builder output. The auditor asks for the income statement with drill-down to source transactions. The Power BI income statement doesn’t drill to BC transaction detail — it shows aggregated data from the dataset refresh. The auditor wants to trace a revenue line to the invoices. Power BI can’t do that. Finance has to reconstruct the tie-out from BC’s native reports, which means running two sets of financial statements every period — one from Power BI for presentation, one from BC for audit support.
Fix: The statutory financial statements — income statement, balance sheet, trial balance used for the audit — should always come from BC’s Financial Report builder or standard reports. These are the source-of-record reports with direct drill-down to underlying BC transactions. Power BI is the presentation layer for trend analysis and KPI dashboards. When auditors arrive, the authoritative numbers come from BC, not from a Power BI dataset that was refreshed at some point before the period closed.
⚠️ No Governance on Who Builds Reports — Competing Versions of the Same Metric
The Sales team builds a Power BI report showing revenue. Finance builds a Power BI report showing revenue. Operations builds a Power BI report showing revenue. All three use the BC connector. All three show different numbers for the same period. The Sales report uses order date; Finance uses posting date; Operations uses shipment date. Nobody established a standard definition of “revenue” for reporting purposes before three different teams built three different reports. Leadership now has three revenue numbers and no way to determine which one is right — because all three are “right” by their own definitions, and none of the definitions was agreed upon in advance.
Fix: Establish a report governance policy before Power BI proliferates across the organization. Define: who is authorized to publish reports to shared workspaces, what the authoritative definitions are for key metrics (revenue = posted sales invoice lines, period = posting date), and which Power BI workspace is the source of truth for each domain. Finance should own the definitions for financial metrics. When everyone builds from agreed definitions, the three revenue reports produce the same number — or the differences are understood and documented.
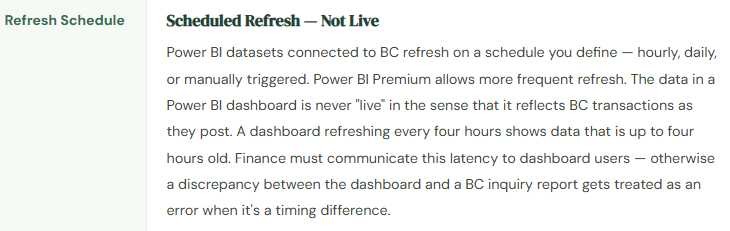
⚠️ Not Communicating Data Freshness to Dashboard Users — Every Timing Difference Becomes a Trust Crisis
The CFO dashboard refreshes overnight. The CFO reviews it at 9 AM and sees $1.8M of open AR. At 9:30 AM, the controller posts a $220K collection that came in yesterday afternoon — it was just processed this morning. At 10 AM, the CFO asks the controller why AR is at $1.8M when she thought it should be closer to $1.6M. The controller explains that the collection was posted this morning after the dashboard refreshed. The CFO’s confidence in the dashboard drops — “if it doesn’t show today’s numbers, how do I know what it’s showing?”
Fix: Display the data refresh timestamp prominently on every shared dashboard. Communicate the refresh schedule to every dashboard user during onboarding — “This dashboard shows data as of the overnight refresh. For current-day activity, use the BC inquiry directly.” Frame the dashboard as the trend and pattern tool; frame BC inquiry as the point-in-time accuracy tool. When users understand the distinction, timing differences are expected rather than alarming. The CFO who knows the dashboard is an 8-hour lag doesn’t worry when a morning transaction isn’t visible yet.
Do This / Don’t Do This
✓ Do This
- Match the reporting tool to the reporting need — use BC Financial Reports for financial statements, Power BI for trend analytics
- Validate BC data quality before building Power BI dashboards
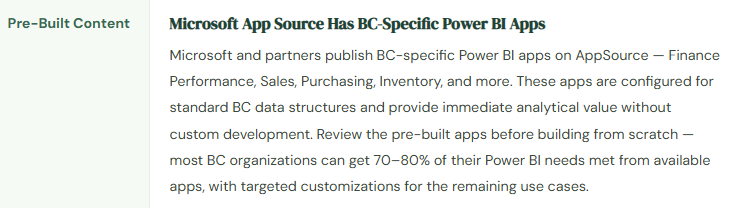
- Review AppSource pre-built BC Power BI apps before building from scratch
- Display data refresh timestamp prominently on every shared dashboard
- Establish a metric definition standard before multiple teams build reports independently
- Designate Power BI workspace governance — who publishes, what the authoritative definitions are
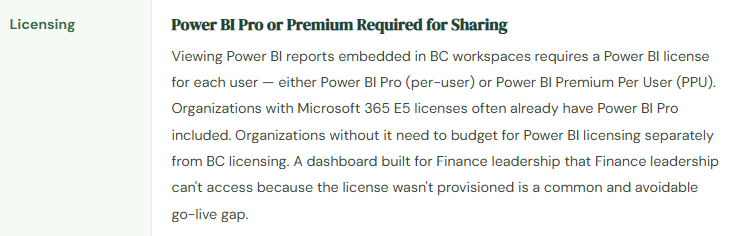
- Provision Power BI licenses for all intended dashboard users before go-live
- Use BC Financial Reports and standard reports for audit-trail-required financial output
- Communicate data freshness schedule to all dashboard users as part of onboarding
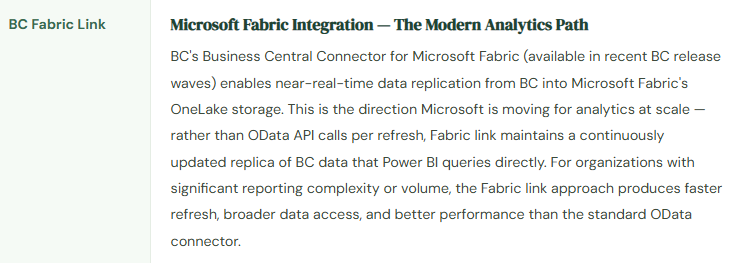
- Explore the BC Fabric link for organizations with significant analytics volume or complexity
✗ Don’t Do This
- Build Power BI on top of dirty BC data — the dashboard will surface data quality problems in front of the wrong audience
- Use Power BI for the statutory income statement — it can’t drill to BC transaction detail for auditors
- Let multiple teams build revenue reports without agreed metric definitions — you’ll end up with three different revenue numbers
- Assume Power BI shows real-time BC data — it doesn’t; it shows data as of the last scheduled refresh
- Rebuild standard BC reports in Power BI — aged AR in Power BI is not better than aged AR in BC
- Deploy dashboards without communicating refresh frequency to users
- Forget to budget Power BI Pro licenses for dashboard users separate from BC licensing
Up Next:
The reporting layer is now mapped. The next post addresses the capabilities Microsoft is building into BC itself to assist the work Finance does daily: Copilot and AI Features in Business Central — what’s actually live, what’s genuinely useful, what requires careful governance before Finance adopts it, and the honest practitioner’s view of where AI in BC is today versus where the marketing suggests it is.
— Bobbi
D365 Functional Architect · Recovering Controller
Thank you for reading!
If this post helped you solve a real problem, share it with a Finance colleague who is in the middle of a BC implementation or a post-go-live optimization. If you have a topic that I haven’t covered, please reach out. There is always one more post worth writing.
Leave a Reply