
How Account Schedules work, the difference between Account Schedules and standard GL reports, how to build a management-ready income statement with custom subtotals and ratios, the Column Definitions that drive multi-period and budget-vs-actual layouts, the Analysis Views that add dimensional cuts, and the path from BC’s default reports to the reporting infrastructure a controller actually needs.
What Account Schedules Are—and Why They Are BC’s Core Reporting Tool
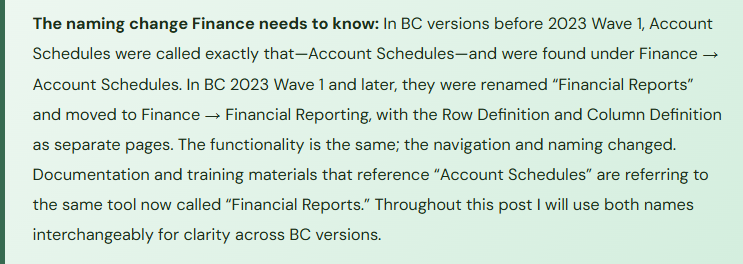
Account Schedules (found under Finance → Financial Reporting, labeled “Financial Reports” in recent BC versions) are BC’s tool for building structured, formatted financial statements that combine multiple GL accounts, apply custom formulas, and present results across user-defined column layouts. They are the equivalent of Management Reporter in D365 F&O or Financial Statements in QuickBooks—except they are natively built into BC, require no additional license, and can produce any financial statement format Finance requires.
An Account Schedule has two components that work together: the Row Definition (which rows appear in the report and what each row contains) and the Column Definition (which columns appear and what time period or amount type each column represents). The Row Definition and Column Definition are separate saved objects that can be mixed and matched—the same income statement row definition can be displayed with a current-month column definition for the monthly close report or a trailing-12-months column definition for the board presentation, without rebuilding the row structure.
Row Definitions—Building the Report Structure
The Row Definition is where Finance defines the shape of the financial statement: which rows appear, what each row is labeled, and where each row gets its data. Each row in the definition has a Row Type that determines its behavior:
| Row Type | What It Does | Common Finance Use |
|---|---|---|
| Accounts | Pulls the balance from one or more GL accounts or an account range. The Totaling field accepts a single account number, a range (6000..6999), or a combination with pipes (6000|6100|6200). | Individual P&L line items: Salaries, Rent, Utilities, Direct Materials. Any row that maps to specific GL accounts. |
| Formula | Calculates a value using a formula referencing other row numbers in the same schedule. Row 50 can equal Row 10 minus Row 20 minus Row 30. Formulas support addition, subtraction, multiplication, division, and parenthetical grouping. | Gross Margin (Revenue minus COGS), EBITDA (Operating Income plus Depreciation and Amortization), Gross Margin % (Gross Margin divided by Revenue). Any derived metric that doesn’t exist in a GL account. |
| Total | Sums a range of row numbers. Simpler than Formula for straightforward subtotals. | Total Operating Expenses (sum of rows 60 through 90), Total Revenue (sum of rows 10 through 15). |
| Begin-Total / End-Total | Marks the beginning and end of a collapsible section. In the rendered report, the section can be expanded to show detail or collapsed to show only the total line. The End-Total row computes the sum of all rows in the section. | Collapsible revenue sections (Product Revenue, Service Revenue, Other Revenue all collapsed under Total Revenue for the board-level report, expandable for management detail). |
| Set Base for Percent | Designates a row as the base for percentage calculations in other rows that use the Show as % option. | Setting Net Revenue as the base so that every expense row can display as a % of revenue in a margin analysis column. |
| Description | A text-only row with no calculation—adds a label, a blank line, or a section header to the report. | Section headers (OPERATING EXPENSES, NON-OPERATING ITEMS), blank separator rows between sections. |
Column Definitions—Building the Report Columns
The Column Definition determines how many columns appear in the report and what each column contains. Each column in the definition specifies a Column Type, a Ledger Entry Type, and the period formula that determines which dates the column covers. The power of Column Definitions is that they are independent of the Row Definition—Finance builds one income statement row structure and can pair it with any column layout: single-month actual, three-month comparison, actual vs. budget vs. prior year, trailing twelve months.
| Column Setup | Column Type | Period Formula | Finance Use |
|---|---|---|---|
| Current Month Actual | Net Change | <CP> (current period) | The current month’s activity for each row. Use Net Change for income statement rows (monthly P&L) and Balance at Date for balance sheet rows (point-in-time balance). |
| Year-to-Date Actual | Net Change | <-FY+1:CP> (from fiscal year start to current period) | Cumulative activity from the start of the fiscal year through the current period. Essential for any YTD P&L or YTD expense report. |
| Budget—Current Month | Budget Amount | <CP> | The budget entered in BC’s GL Budget for the current period. Requires that a GL budget has been loaded into BC—see Post 11 on Budgeting for the budget entry process. |
| Variance (Actual minus Budget) | Formula | N/A—formula referencing column numbers | The column type “Formula” allows a column to be a calculation of other columns. Column D = Column B minus Column C (actual minus budget). Shows favorable/unfavorable variance directly on the report. |
| Prior Year Same Month | Net Change | <-1Y+CP> (current period minus 1 year) | The same month in the prior fiscal year. Combined with a Current Month Actual column and a Variance column, produces a year-over-year comparison report. |
| % of Revenue | Formula | N/A—formula using Show as % | Displays each row as a percentage of the row designated as the base (Set Base for Percent in the Row Definition). Produces a common-size income statement alongside the dollar amounts. |
A Working Income Statement Layout—What Finance Should Build First
The standard management income statement most controllers need includes: current-month actual, current-month budget, current-month variance, year-to-date actual, year-to-date budget, year-to-date variance, and optionally a % of revenue column. The Row Definition for the income statement includes rows for each revenue line, a gross revenue total, COGS lines, a gross margin total, operating expense lines by category, an operating income total, non-operating items, and a net income row.
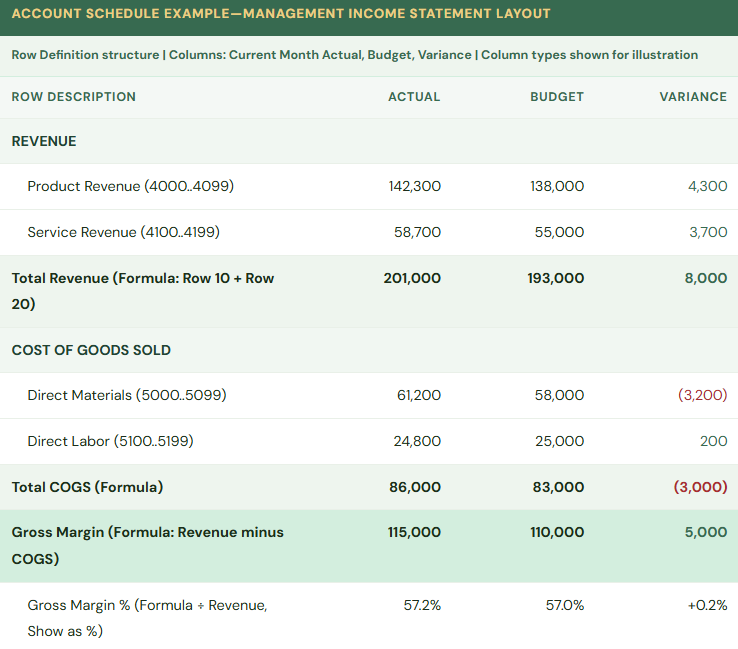
The Gross Margin % row uses the Formula row type with the Show as % option enabled. It does not pull from any GL account—it divides the Gross Margin row by the Total Revenue row and displays as a percentage. No GL account in BC stores this number; Account Schedules calculate it live from the GL data every time the report runs.
Analysis Views—Adding Dimensional Cuts to Account Schedules
An Account Schedule with no dimension filter shows company-wide totals. The same schedule paired with an Analysis View can be filtered by department, cost center, region, project, or any other financial dimension—producing the departmental P&L, the regional revenue breakdown, or the project profitability report that management needs without building a separate Account Schedule for each cut.
What an Analysis View Does
An Analysis View is a separately maintained data cube that pre-summarizes GL entries by account and up to four financial dimensions. When an Account Schedule references an Analysis View, it can filter and group by the dimension values in the view—showing Department = Marketing’s P&L, or Region = West’s revenue, or Project = Acme P&L, from the same income statement row definition.
Setting Up an Analysis View
Define the Analysis View under Finance → Analysis Views. Assign up to four dimensions to the view (e.g., Department, Region, Project, Customer Group). Enable “Update on Posting” to keep the view current as transactions post, or update manually before running analysis reports. Once the view exists, Account Schedules reference it in the report setup to enable dimensional filtering.
Department P&L from a Single Account Schedule
With a Department dimension and an Analysis View, Finance runs the standard income statement Account Schedule filtered to Department = “Operations” for the Operations P&L, then filtered to Department = “Sales” for the Sales department P&L, then unfiltered for the company-wide view. Same row definition, same column definition, different dimension filter each time.
The Analysis View Update Timing
If “Update on Posting” is not enabled, the Analysis View only reflects transactions through the last manual update. Finance that runs a dimensional P&L from an Analysis View without confirming the view is current may be looking at data that is days behind the GL. Confirm the view’s Last Updated date before presenting dimensional reports in management meetings.
Five Account Schedule Mistakes That Produce Wrong Numbers Quietly
⚠️ New GL Account Added to the Chart of Accounts—Account Schedule Doesn’t Include It—Expenses Are Missing from the P&L
The Controller adds a new GL account (6850 — Software Subscriptions) in BC and begins posting $4,200 per month to it. The income statement Account Schedule was built with a row that totals operating expenses using an account range of 6000..6799. Account 6850 is outside that range. It does not appear in the Account Schedule. The software subscription expense posts correctly to the GL every month. The Account Schedule’s operating expense section does not include it. The management income statement is understating operating expenses by $4,200 per month for four months before Finance notices during a budget reconciliation that the total expenses on the Account Schedule don’t agree to the trial balance total. The $16,800 of missing expense produces an overstated net income on four months of management reports.
Fix: Chart of accounts changes must include a review of every Account Schedule row that uses account ranges to verify the new account falls within an existing range or a new row is added. The review is a required step in the chart of accounts change management process—the same process described in Post 2 of this series. The Account Schedule’s coverage can be verified by comparing the sum of all Account Schedule rows to the trial balance total for the same period and date range. Any difference indicates an account that is in the GL but not in the Account Schedule. Build this verification into the monthly close process as a standing reconciliation step: Account Schedule net income must equal the trial balance net income.
⚠️ Budget Column Shows Nothing Because the GL Budget Name Doesn’t Match the Column Definition
Finance spends two days loading the annual budget into BC’s GL Budget under the name “FY2026 Budget.” The Account Schedule column definition for the Budget column has the Budget Name field set to “Annual Budget”—the name used in the prior year. The budget column on every Account Schedule report shows zero for every row. Finance presents the management P&L with a blank budget column for the first two months of the fiscal year before discovering that the mismatch is a one-field configuration error in the column definition.
Fix: After loading a new annual budget into BC, verify that every Account Schedule column definition that references a budget name is updated to match the new budget name exactly (case-sensitive in some BC versions). The verification takes five minutes: open each column definition used in the management reporting Account Schedules, find the Budget Name field on the budget columns, confirm the name matches the loaded budget. Do this immediately after budget loading, before the first management report that includes a budget column is run. The budget name is not a smart default—it must be maintained manually when the budget is renamed or a new year’s budget is loaded under a new name.
⚠️ Row Formula Has Wrong Sign Convention—Gross Margin Shows Negative All Year
The income statement Account Schedule is built with revenue accounts in rows 10–30 and COGS accounts in rows 40–60. The Gross Margin row uses the formula 10+20+30-40-50-60. Revenue GL accounts in BC carry credit balances, which in the Account Schedule show as negative numbers by default (because the GL stores them as credits and the schedule displays the raw balance). COGS accounts carry debit balances and show as positive. The formula produces: (-201,000) + (86,000) = -115,000. Gross Margin shows as a negative $115,000 instead of a positive $115,000. Finance adjusts the display by selecting “Reverse Sign” on the revenue rows, but applies it inconsistently—some revenue rows have Reverse Sign enabled and some do not. The gross margin calculation is wrong for four months because different rows are being sign-reversed differently.
Fix: Before building Account Schedule formulas, establish a consistent sign convention for the entire schedule and apply it to every row. The standard approach: enable “Reverse Sign” on all revenue and liability rows so they display as positive numbers (making the natural reading of the schedule match GAAP presentation where revenues are positive). COGS and expense rows display as positive without reversal. With this convention, Gross Margin formula = Revenue Total minus COGS Total produces a positive gross margin without sign manipulation in the formula. Test the sign convention by running the schedule for a period where you know the expected results and confirming that every row shows the correct sign and the gross margin, operating income, and net income lines are positive when the company is profitable.
⚠️ Analysis View Not Updated Before Running the Department P&L—Last Month’s Data Presented as Current
Finance runs the department P&L reports for the management meeting using Account Schedules filtered by the Department dimension through an Analysis View. The Analysis View was last updated three days ago, before $48,000 of period-end accrual journals were posted—journals that affect six of the eight departments. The department P&L reports Finance presents show pre-accrual figures. Three department heads raise questions during the meeting: their expense totals don’t match their own cost tracking. Finance investigates post-meeting and discovers the Analysis View update gap. Corrected reports go out the next day, but the management meeting was conducted on stale data and the department managers’ trust in the Finance reporting process is shaken.
Fix: For any management meeting where Account Schedule reports filtered by Analysis Views will be presented, the Analysis View must be updated immediately before the reports are run—not the last time it happened to be updated. If “Update on Posting” is enabled, the view should be current automatically; verify the Last Updated timestamp before the meeting to confirm. If the view is manually updated, the update must be run as the last step before report generation on the meeting day. Build the Analysis View update into the close checklist as a required step before any dimensional reports are distributed. The Last Updated date should appear on every dimensional report as a data quality indicator.
⚠️ Account Schedule Is Built Once and Never Maintained—Three Years Later It No Longer Matches the Financial Statements
The Account Schedule for the management income statement was built by the implementation partner during the go-live project. It was accurate at implementation. Over three years: the chart of accounts has expanded by 34 accounts, two accounts have been inactivated, the organization restructured and changed its department dimension values, a new revenue stream was added with its own account range, and the budget naming convention changed. Nobody updated the Account Schedule after any of these changes. The current Account Schedule covers 71% of the accounts in the active chart of accounts. The management income statement has been understating expenses and omitting a revenue category for eight months. The discrepancy surfaces when a new Controller joins the organization and reconciles the Account Schedule totals to the trial balance for the first time.
Fix: Account Schedules are living documents that require maintenance as the business and the chart of accounts evolve. Establish an Account Schedule maintenance protocol: at every chart of accounts change, review the affected Account Schedules and update them. At every fiscal year rollover, review all Account Schedules for coverage completeness—compare the Account Schedule income statement total to the trial balance income statement total for a recent closed period and investigate any difference. When the organization restructures and dimension values change, update the Account Schedules that filter by those dimensions. The Account Schedule is the management reporting infrastructure; it requires the same governance as the chart of accounts and the posting groups that feed it.
Do This / Don’t Do This
Do This
- Build a management income statement Account Schedule with Gross Margin, EBITDA, and net income formula rows as a Finance deliverable—not a nice-to-have after go-live
- Establish a consistent sign convention (Reverse Sign on revenue rows) before building formula rows
- Verify Account Schedule coverage against the trial balance at every monthly close: Account Schedule net income = trial balance net income
- Include an Account Schedule coverage review in the chart-of-accounts change management process
- Update Analysis Views immediately before running dimensional reports for management meetings
- Build Column Definitions for the specific report layouts management needs: current month, YTD, budget vs. actual, prior year comparison
- Treat Account Schedules as living documents that require maintenance—review coverage at every fiscal year rollover
- Confirm budget column Budget Name matches the loaded GL budget name after each annual budget load
Don’t Do This
- Use account ranges in row definitions without reviewing them when new accounts are added to the chart of accounts
- Present dimensional reports from Analysis Views without confirming the view was updated after the period-end close
- Mix sign conventions across rows in the same schedule—apply Reverse Sign consistently or not at all
- Build the Account Schedule during implementation and never revisit it as the chart of accounts evolves
- Assume the budget column will show correct data without verifying the Budget Name field in the column definition
- Rely on the default BC Trial Balance report for management reporting—it cannot produce the subtotals, ratios, and budget comparisons management needs
- Build separate Account Schedules for each department instead of using Analysis View dimension filters on a single shared schedule
Up Next:
Account Schedules give Finance the reporting infrastructure the system was built to support. The next post takes us into the integration and automation arc: Power Automate and Power BI Integration with Business Central—how Finance connects BC data to the Power Platform, the specific Finance workflows that Power Automate handles well, the Power BI connection methods and their trade-offs, the governance model Finance must own over every automated workflow that touches BC financial data, and the mistakes that turn low-code tools into financial control gaps.
— Bobbi
D365 Functional Architect · Recovering Controller
Thank you for reading!
If this post helped you solve a real problem, share it with a Finance colleague who is in the middle of an ERP implementation or a post-go-live optimization. If you have a topic that I haven’t covered, please reach out. There is always one more post worth writing.
If you are interested in learning more about D365, checking out my latest posts:
- AI and ERP Security: What Copilot Means for Your D365 Security Roles and Internal Controls
- The Natural Language ERP: Stop Running Reports, Start Asking Questions
- AI Adoption in ERP: Why Change Management Is Your Most Critical AI Investment
- Agent 365: Microsoft’s Control Tower for All Your ERP Agents
- AI in D365 Supply Chain: From Demand Planning to Warehouse Intelligence
Leave a Reply